
Concentration is up; diversification isn't gone
Despite rising concentration, the S&P 500 remains broadly diversified. Effective diversification has fallen from roughly 120 stocks pre-pandemic to about 50 today, yet research suggests portfolios of 25 to 30 stocks can still deliver substantial diversification benefits.
Concentration risk in the S&P 500: How concerned should investors be?
There is little debate that US equity markets are more concentrated today than they have been for much of the past several decades. The more important question is how to quantify that concentration and determine whether it presents a meaningful portfolio risk for asset allocators.
HHI index vs. top 10 position weight
One of the simplest ways to measure concentration is by examining the weight of the largest constituents in the index. Today, the top 10 holdings in the S&P 500 account for nearly 40% of the index's total market capitalization. Going back to the mid-1990s, this marks the highest level of concentration observed over the period, and by a considerable margin.
While concentration based on top holdings provides a useful snapshot, it does not fully capture the diversification of the entire index. For that, we can turn to the Herfindahl-Hirschman Index (HHI), a standard measure of market concentration that has historically used by regulators and antitrust authorities to evaluate mergers and acquisitions. Applied to investment portfolios, the HHI can be translated into an "effective number of holdings," providing a more intuitive measure of diversification.
This Herfindahl-Hirschman Index (HHI) calculation takes the sum of all the squared weights of an index The effective number of holdings is calculated as the reciprocal of the Herfindahl-Hirschman Index (HHI).
Effective Number of Holdings = 1 / Σ(wᵢ²)
Viewed through this lens, the S&P 500's effective diversification has declined meaningfully. Prior to the pandemic, the index resembled a portfolio of roughly 120 equally weighted stocks on average. Today, that figure has fallen to about 50 stocks, highlighting a substantial increase in market concentration.
While this reduction is substantial, it does not necessarily imply that the index has become inadequately diversified. A common rule of thumb in portfolio construction suggests that a portfolio of 25 to 30 stocks can eliminate most of the volatility from company-specific risk (Fisher & Lorie, 1970)1. More recent academic research indicates that while the the diversification benefits may be somewhat lower than earlier studies suggested, they remain significant, with portfolios of roughly 30 stocks reducing diversifiable risk by as much as 86% (Surz & Price, 2000)2.
As a result, while investors are undoubtedly receiving less diversification than in prior decades, the S&P 500 continues to retain many of the benefits associated with broad market exposure.
Looking beyond weights: The role of correlations
A reasonable critique of concentration measures is that they focus solely on position weights and ignore the relationships between holdings. This is particularly relevant today, as much of the concentration in the S&P 500 is driven by large technology-oriented companies that may share common earnings drivers, economic sensitivities, and market narratives.
If these companies consistently move together, the true level of diversification may be lower than traditional concentration metrics suggest. We look at the average correlation of the top 10 holdings based 750-day rolling window of daily returns, along with the +/-1 standard deviation range across the 45 pairwise correlations over time (Figure 2).
Figure 2: Top 10 S&P 500 stock correlations
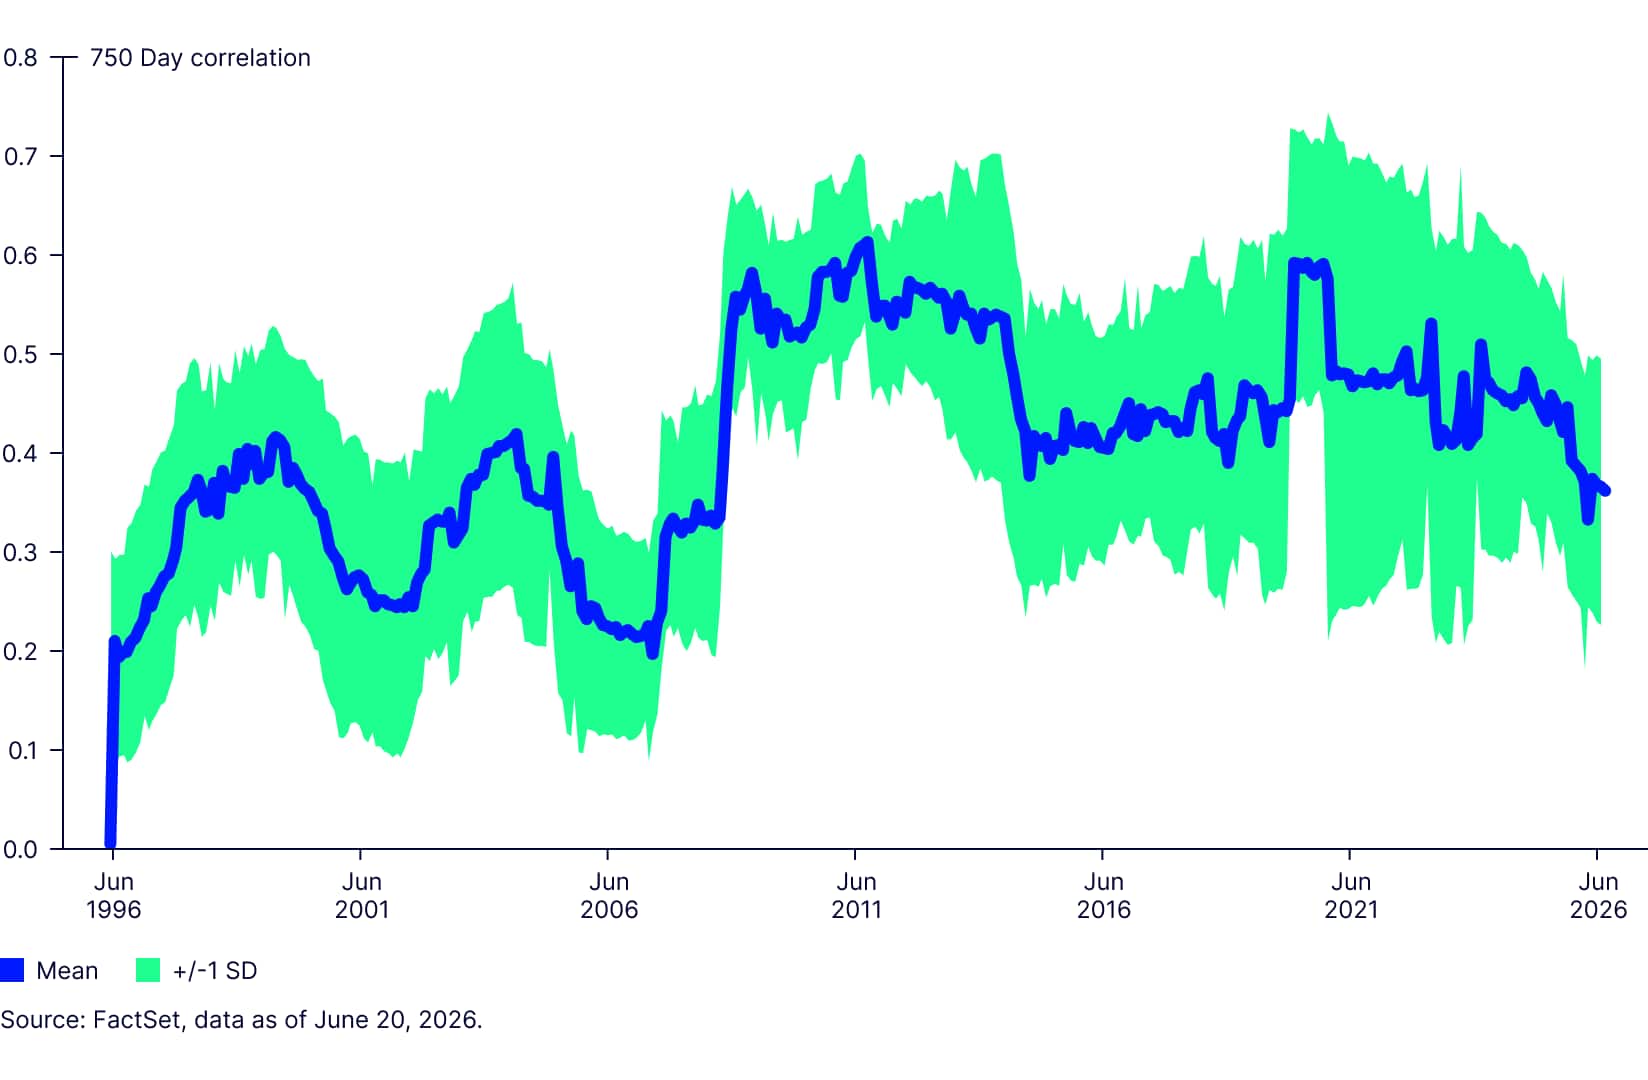
Looking back to the mid-1990s, two distinct correlation regimes emerge. Prior to the Global Financial Crisis, average correlations among the top constituents generally hovered around 0.30. Following the financial crisis, correlations across risk assets shifted structurally higher, reflecting a market increasingly driven by macroeconomic forces and central bank policy.
More recently, however, correlations among the largest holdings have trended lower. Equally notable, the dispersion of those correlations has narrowed considerably, indicating more consistent and predictable relationships across the group.
While the largest stocks continue to represent a significant share of the index, they are not behaving as a single, highly correlated trade. One explanation is the increasingly diversified nature of these businesses, many of which generate revenue across multiple segments with distinct economic drivers. For example, Amazon derives revenue from cloud computing, e-commerce, advertising, and subscription services, each influenced by different market forces.
In addition, many mega-cap companies have substantial global operations, with several generating a majority of their revenue outside the United States. As a result, headline concentration statistics may overstate the decline in diversification within the market. Rather than representing a single concentrated source of risk, these firms often provide exposure to a broad range of business lines, end markets, and geographic regions, helping maintain diversification despite their increasing index weights.
What does this mean for investors?
The evidence suggests that today's S&P 500 exhibits more active-like characteristics than it has been historically. A smaller group of companies is driving a larger share of index returns, increasing the impact of individual stocks and sectors on overall performance.
However, that does not mean the index should be viewed as poorly diversified. Despite elevated concentration, the effective diversification of the S&P 500 remains well above the levels typically associated with concentrated portfolios, and correlations among its largest components have recently become more supportive of diversification.
For investors with a constructive view on technology, artificial intelligence, and the broader innovation economy, the S&P 500 remains a compelling core allocation and an efficient way to participate in long-term US economic growth and innovation trends.
That said, investors with shorter time horizons, lower risk tolerance, or concerns about concentration risk may consider complementing traditional market-cap-weighted exposures with strategies designed to broaden diversification. Equal-weight, factor-based, or smart beta approaches can reduce reliance on a handful of mega-cap stocks while maintaining exposure to the broader US equity market.
Similarly, increasing allocations to non-US equities or alternative asset classes may help broaden sources of return and reduce portfolio reliance on the performance of a small number of dominant companies.
Ultimately, concentration risk in the S&P 500 is real and warrants ongoing attention. Yet the data suggest that current market conditions are better characterized as a reduction in diversification rather than an outright absence of it.
For most investors, the appropriate response is not necessarily to abandon market-cap-weighted indexing, but rather to evaluate whether portfolio’s diversification remains consistent with their long-term objectives and risk tolerance.