SAFI turns 2: Delivering consistent alpha, controlled risk
“We are what we repeatedly do. Excellence, then, is not an act, but a habit.”
In the two years since launching our Systematic Active Fixed Income (SAFI) strategies,i we have seen presidential elections, volatility spikes and reversions, and wide swings in investment-grade credit spreads. Despite these challenges, SAFI has delivered results that have exceeded expectations. The journey to this significant milestone reflects the strength of a disciplined, factor-diversified investment approach that consistently delivered strong results, resilient performance, and robust risk management. In the pursuit of returns, downside protection, and innovative ways to meet our clients’ investment objectives, SAFI has consistently demonstrated its value as part of our suite of fixed income products.
What SAFI has delivered:
- Competitive and consistent alpha (1st or 2nd quartile) with low realized tracking error, leading to top-quintile information ratios, gross of fees.
- A factor-diversified approach that performed in a variety of market environments, providing downside protection during market drawdowns.
- Disciplined risk management approach delivering modest, repeatable returns through the cycle – without concentrated risk.
Strong and consistent performance with downside protection
Over the past two years, SAFI has generated competitive excess returns with appreciably low tracking error. As shown in Figure 1, the Systematic US High Quality Intermediate and Long Corporate Bond strategies (“HQ Intermediate” and “HQ Long”) outperformed their respective benchmarks by 75 and 79 basis points (bps), on an annualized gross-of-fees basis. This compares favorably to alpha targets of 50-75 bps.
Figure 1: SAFI strategy performances as of 12/31/25
| Intermediate (1-10Yr) Portfolio | Long (10+ Yr) Portfolio | ||
| 1 Year (%) | Since SAFI Inception (%)* | 1 Year (%) | Since SAFI Inception (%)* |
Systematic US High Quality Corporate Bond (Gross) | 8.25 | 5.91 | 7.72 | 2.5 |
Benchmark | 7.75 | 5.16 | 7.44 | 1.71 |
Excess Return (Gross) | 0.5 | 0.75 | 0.28 | 0.79 |
Systematic US High Quality Corporate Bond (Net) | 8.24 | 5.9 | 7.71 | 2.49 |
Benchmark | 7.75 | 5.16 | 7.44 | 1.71 |
Excess Return (Net) | 0.48 | 0.73 | 0.27 | 0.78 |
Tracking Error Volatility | 0.13 | 0.28 | 0.38 | 0.44 |
Information Ratio | 3.89 | 2.66 | 0.75 | 1.81 |
Source: State Street Investment Management. As of December 31, 2025. The Systematic US High Quality Corporate Bond portfolios were converted to the SAFI investment process as December 31, 2023.
The performance data quoted represents past performance. Past performance does not guarantee future returns. Performance returns for periods of less than one year are not annualized. The performance figures contained herein are provided on a gross and net of fees basis. Gross of fees do not reflect and net of fees reflect the deduction of advisory or other fees which could reduce the return. The performance shown is of a composite consisting of all discretionary accounts using this investment strategy. The above information is considered supplemental to the GIPS presentation for this Composite, which can be found in the Appendix or was previously presented. A GIPS presentation is also available upon request.*Inception Date: December 31, 2023. Fund history predates this period; however, it was not managed using the SAFI approach. The benchmark for the SAFI intermediate strategy is the Bloomberg Intermediate Corporate ex Baa Index. The benchmark for the SAFI long strategy is the Bloomberg Long Corporate A+ Index.
Our focus is on compounding modest, repeatable gains rather than pursuing outsized but uncertain outcomes. Our disciplined risk-controlled process allows us to minimize realized tracking error, while maximizing gross information ratios (IR) to 2.7 and 1.8, respectively.ii Performance has also been consistent, with upside monthly excess returns outweighing the downside: the HQ Intermediate strategy outperformed its benchmark in 19 of the past 24 months by an average of +8 bps; in the other five months, negative alpha averaged -2 bps. The HQ Long strategy outperformed in 17 of the 24 months with average excess returns of +12 bps; in the seven ‘down’ months, alpha averaged -7 bps.
Relative to their active credit manager universes, HQ Intermediate generated consistent alpha with top-decile IR, while HQ Long delivered top quintile alpha and IR, all on a gross of fee basis. Another important outcome for investors in both strategies was that the maximum alpha drawdowns compared favorably with that of other managers in their respective eVestment universes (see Figure 2). Finally, the realized alpha profile is diversifying relative to fundamental active strategies, with an average correlation of 0.3 and 0.2 for the HQ Intermediate and HQ Long strategies, respectively.
Figure 2: US Corporate and Long Credit Fixed Income Universes (12/31/2023 – 12/31/2025)
| US Corporate Fixed Income | Excess Return | % Rank | Tracking Error | % Rank | Information Ratio | % Rank | Max Alpha Drawdown | % Rank |
| State Street Systematic High Quality Intermediate Corp | 0.75 | 45 | 0.29 | 18 | 2.6 | 9 | -0.05 | 5 |
| 25th Percentile | 0.95 | 0.33 | 2.2 | -0.17 | ||||
| Median | 0.63 | 0.46 | 1.53 | -0.28 | ||||
| 75th Percentile | 0.38 | 0.67 | 0.73 | -0.55 |
| US Long Duration - Credit Fixed Income | Excess Return | % Rank | Tracking Error | % Rank | Information Ratio | % Rank | Max Alpha Drawdown | % Rank |
| State Street Systematic High Quality Long Corp | 0.78 | 11 | 0.45 | 48 | 1.75 | 16 | -0.27 | 42 |
| 25th Percentile | 0.66 | 0.32 | 1.49 | -0.21 | ||||
| Median | 0.38 | 0.46 | 0.8 | -0.34 | ||||
| 75th Percentile | 0.11 | 0.62 | 0.29 | -0.51 |
Sources: eVestment, State Street Investment Management. As of December 31, 2025. Performance analysis uses monthly data gross of management fees from December 31, 2023 to December 31, 2025. The gross performance reflects transaction costs but does not reflect management fees and other fees and expenses a client would have to pay, which reduce returns. The performance data quoted represents past performance. Past performance does not guarantee future returns.
Performance attribution: Balanced, diversified factor contributions and implementation skill
The strong and consistent performance of our strategies has been driven by contributions from a variety of sources. Chief among them were the following:
- Our factor-diversified approach that performs across different market environments.
- Our skill and expertise in generating Implementation alpha, as evidenced by our low realized transaction costs.
- Our nimble yet systematic approach that enables greater responsiveness to market changes.
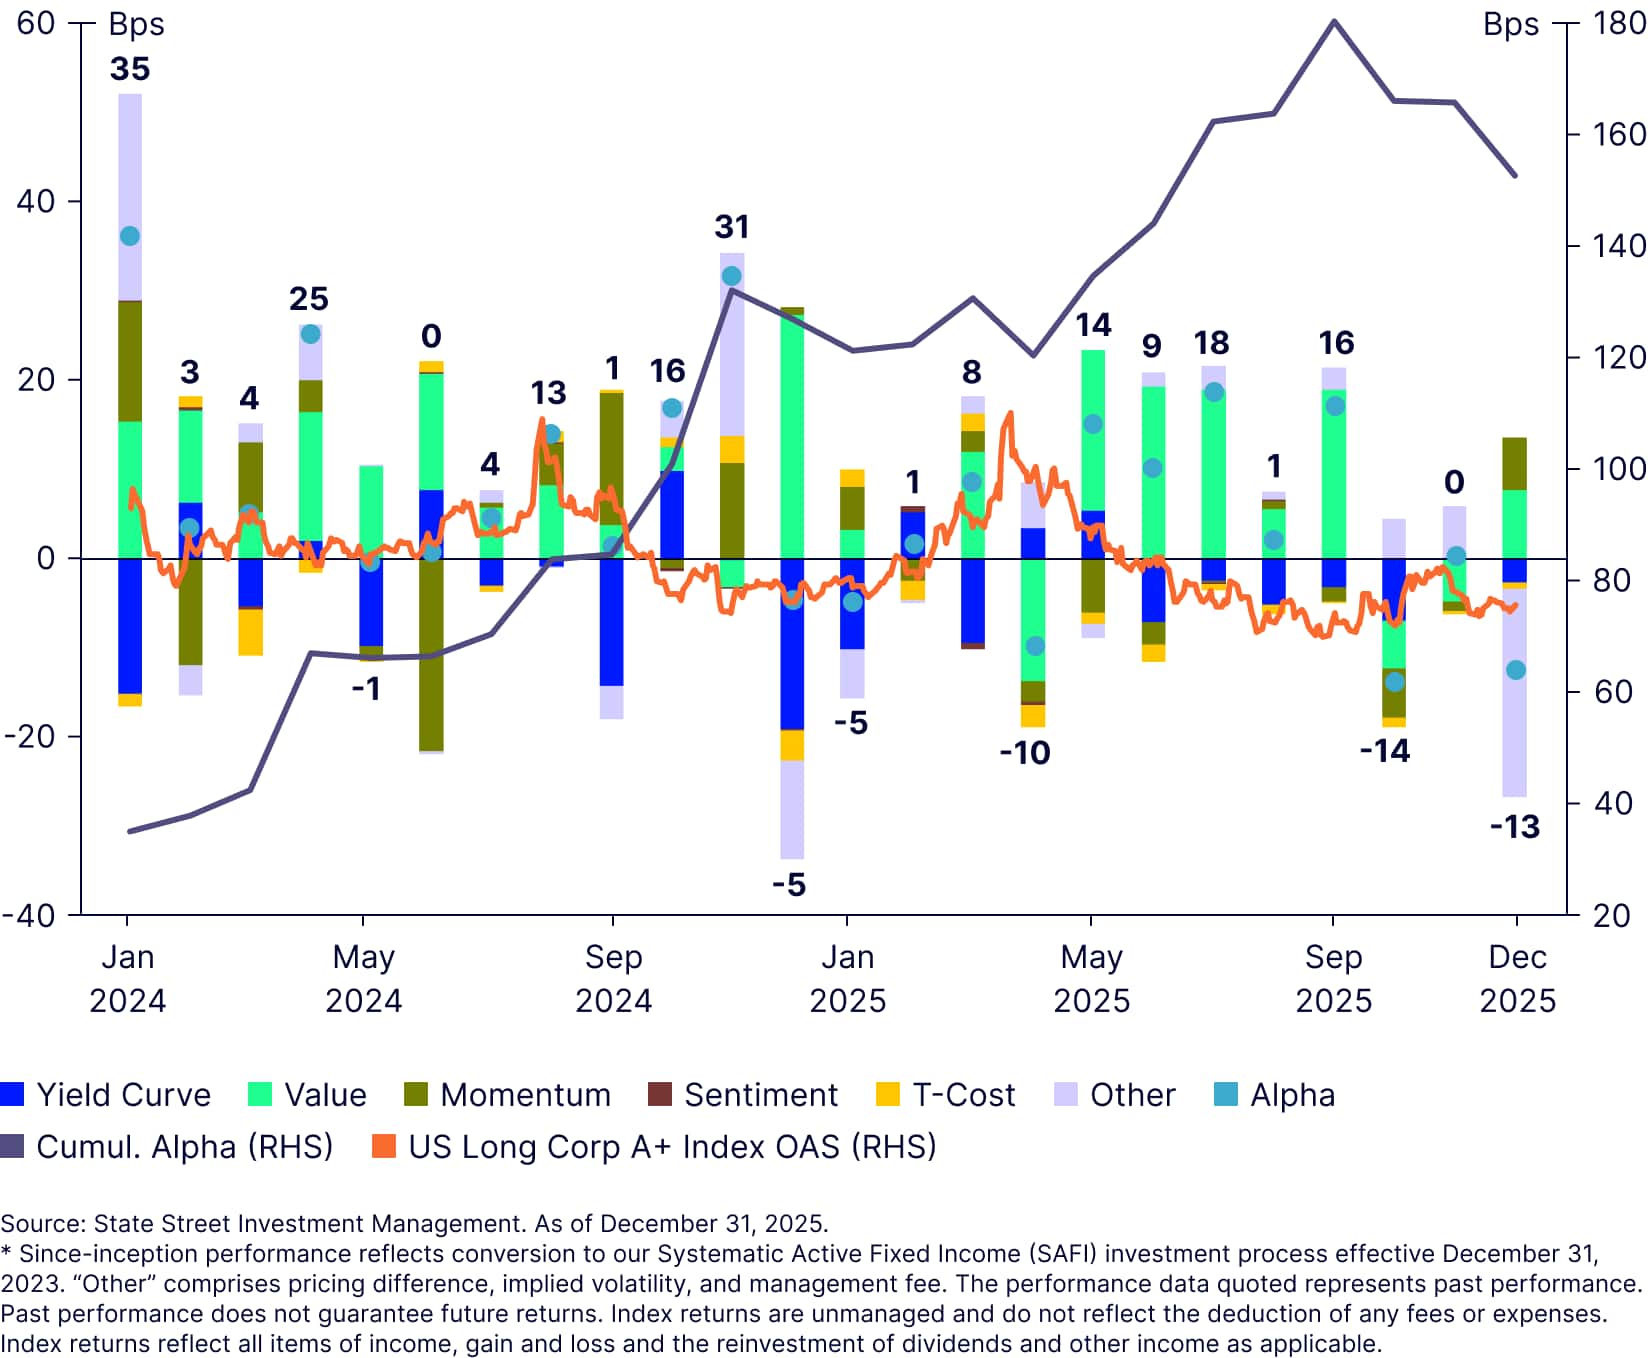
As reflected in Figure 3, value and momentum factors were key contributors across the two-year period, while sentiment played a comparatively minor role. Overall, 2024 was a stronger year for both value and momentum, while value was the primary driver in 2025. Momentum’s contribution was more impactful in the HQ Intermediate strategy due to greater liquidity and primary market participation.
Figure 3a: Performance attribution for SAFI HQ Intermediate strategy (2024-2025)
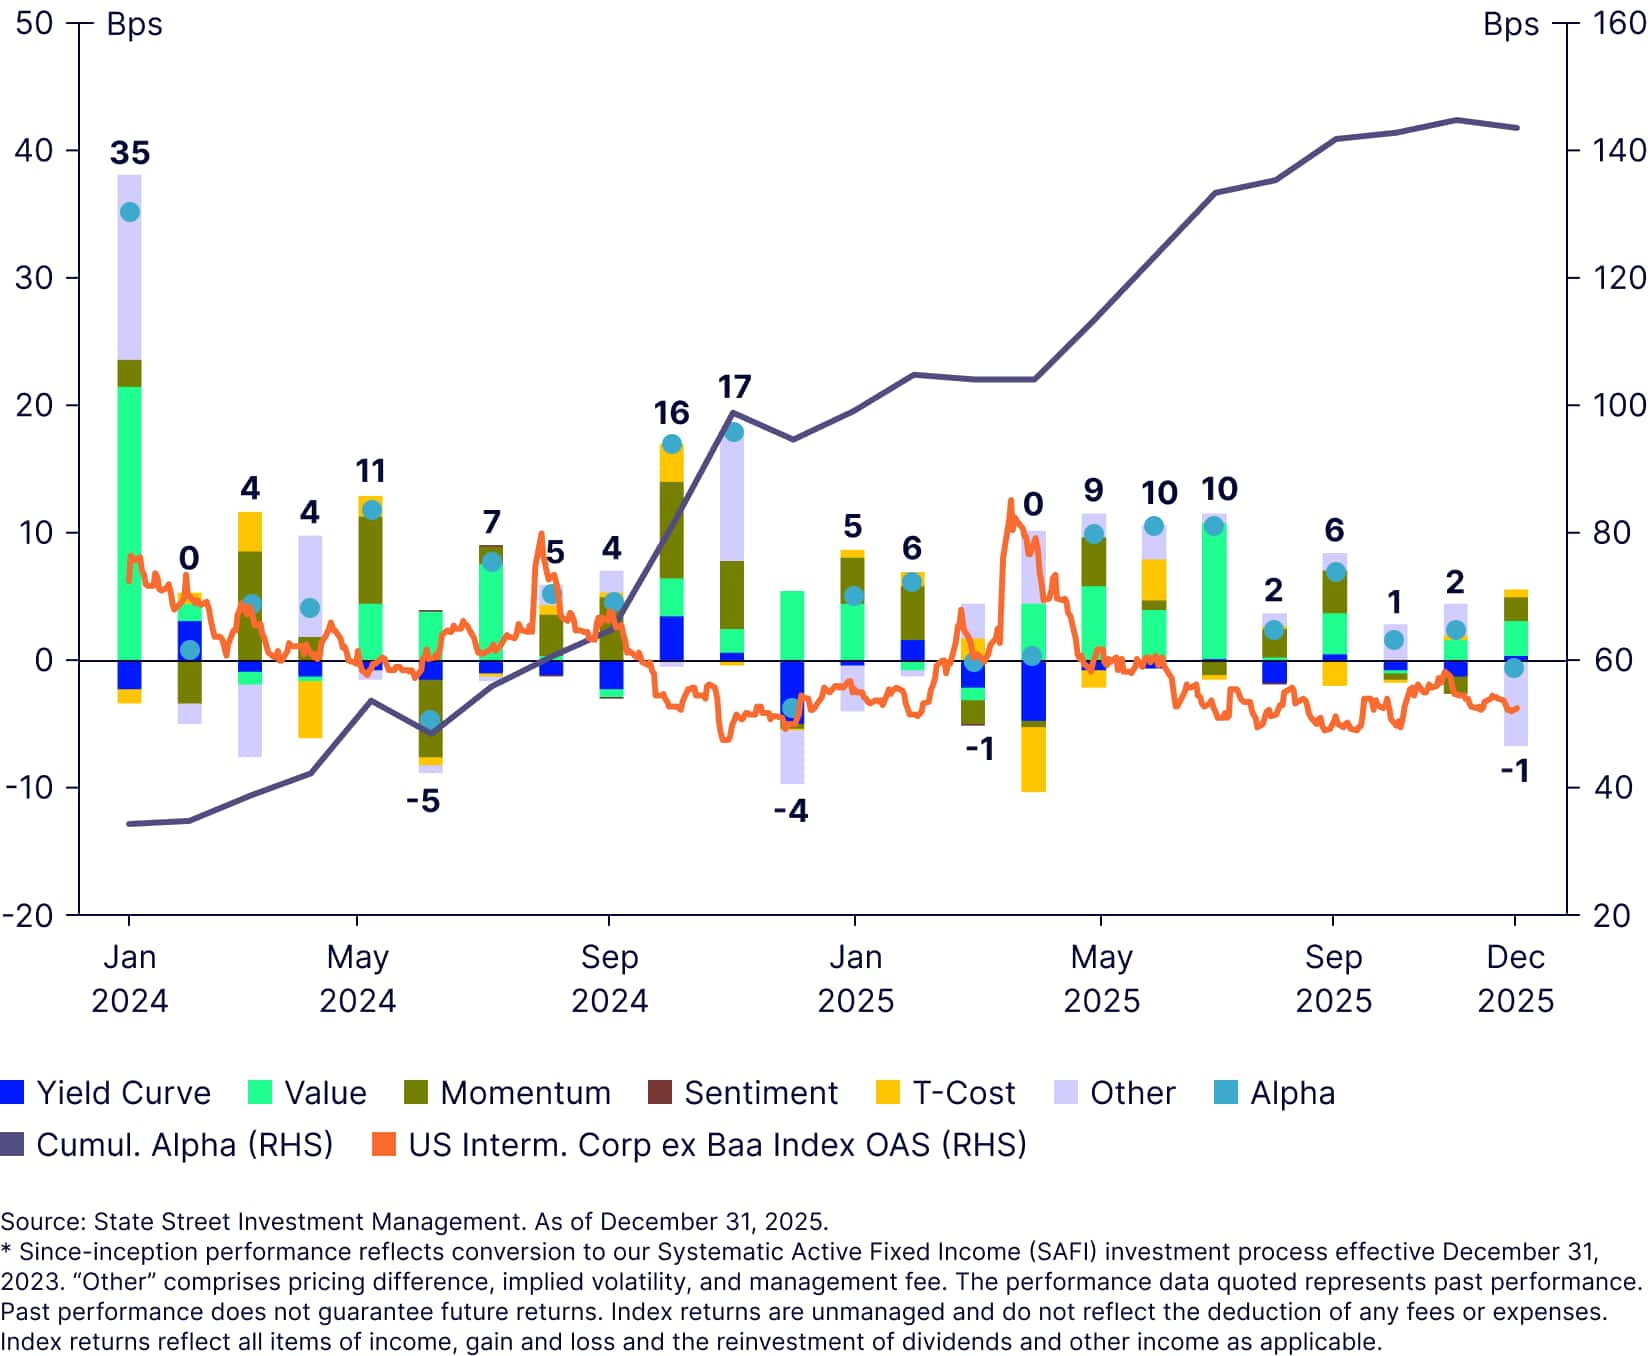
Figure 3b: Performance attribution for SAFI HQ Long strategy (2024-2025)
Under the hood: A closer look at our process
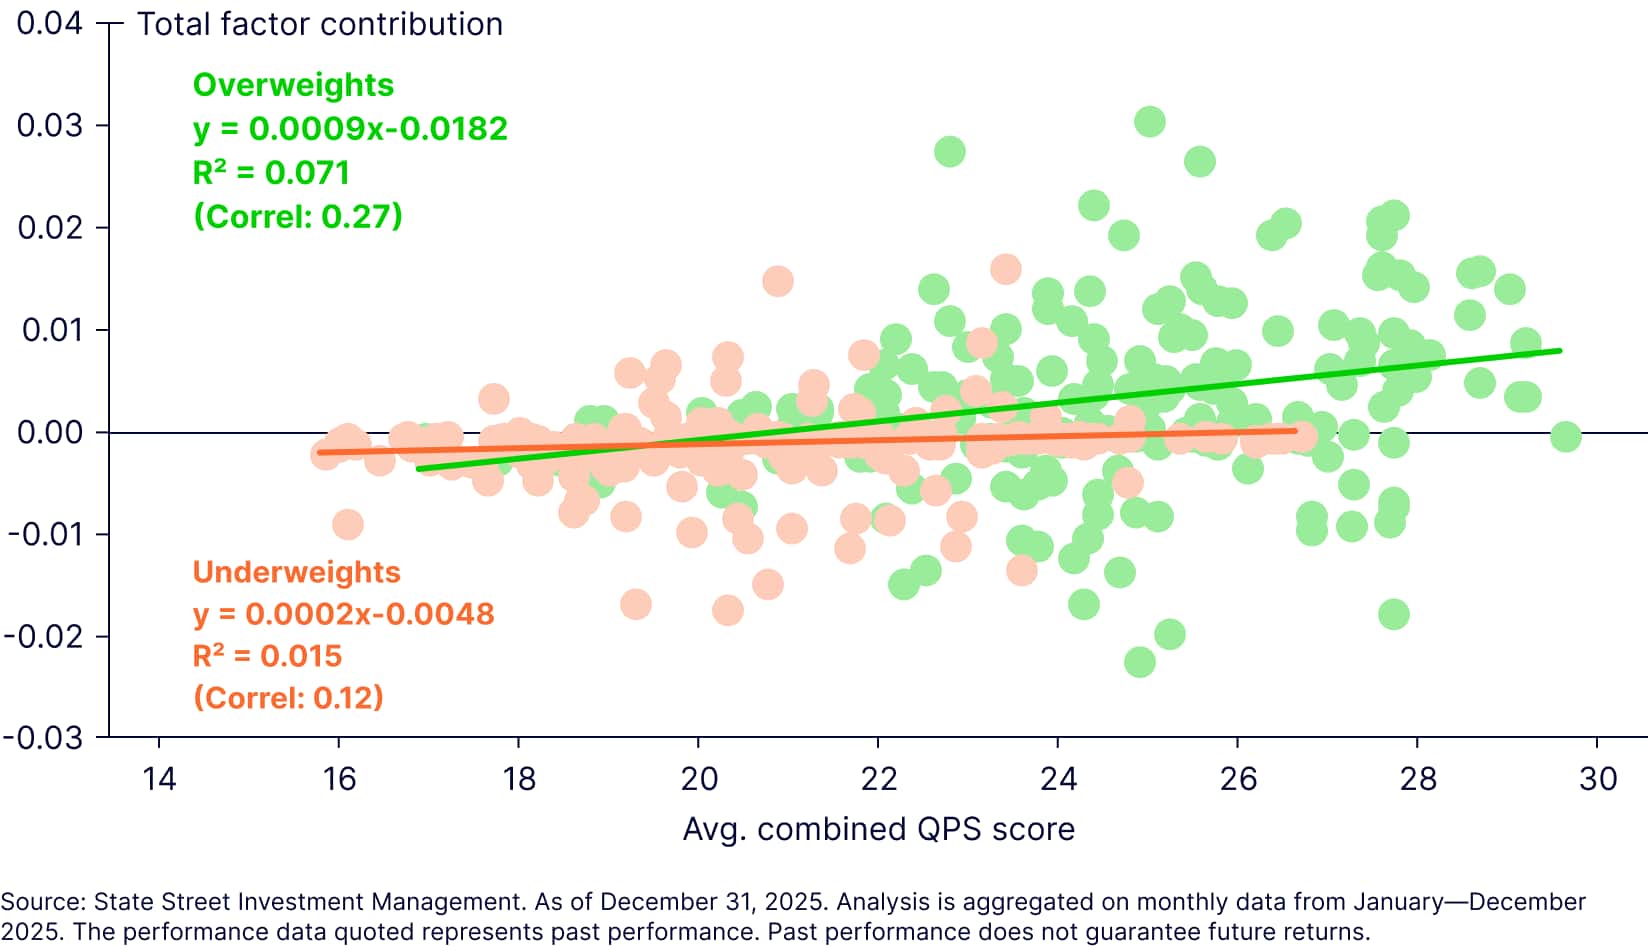
Our goal is to systematically enhance our SAFI portfolios’ exposure to value, momentum, and sentiment by optimizing their overall factor scores. Our proactive process (which is covered in greater detail here) facilitates ongoing improvement in portfolio factor exposures. We sell bonds whose scores have deteriorated and buy high-scoring bonds—with portfolio tilts often led by the momentum factor. As a result, we tend to overweight high-scoring bonds and underweight low-scoring ones. As illustrated in Figure 4, our overweight positions in the HQ Intermediate strategy have generated significantly more factor contributions to alpha than our underweights.
Figure 4: SAFI HQ Intermediate factor scores and contributions, by overweights and underweights (2025)
In practice, we seek to “pick up nickels and dimes while only losing pennies.” If we can accomplish this efficiently, then we maximize the probability of outperformance in the long run. The distribution of factor contribution outcomes at the ticker level for 2025 (Figure 5) shows that we’ve been able to both limit the left side (weaker outcomes) of the distribution for overweights and heavily skew that distribution to the upside. Conversely, for underweighted tickers, we mostly lost small fractions of basis points. On a net-net basis, our overweights generated +65 bps of factor contribution to alpha while our underweights detracted -20 bps.
What’s next for SAFI?
SAFI has exceeded our expectations in the first two years of live track records, delivering better outcomes for our clients in the form of: (1) competitive and consistent alpha with low realized tracking, (2) diversification with respect to the factors and as a complement to fundamental active, and (3) a transparent, carefully risk-controlled investment approach.
We look forward to launching new vehicles and exposures, and exploring innovative ways that SAFI can better help our clients achieve their goals. SAFI has a bright future, and we hope that you will join us on this journey. Please don’t hesitate to reach out if you are interested in learning more about SAFI.
For additional insights and to learn more about SAFI at State Street Investment Management, please visit our website