Why & How S&P 500 ESG Leaders Works
S&P 500 ESG Leaders excludes controversial business activities and favours stocks with best-in-class ESG scoring. With similar industry group weights to the S&P 500, tracking is kept low, with any difference in performance historically being to the ESG Leaders benefit. It has the highest return of all S&P ESG indices over the past 3 years.
Overview
The S&P 500 ESG Leaders index methodology offers access to securities with stronger than average ESG characteristics as well as key activity and behavioural exclusion screens. The index has proved popular given its broad allocation which maintains similar risk-return characteristics to its parent benchmark, the popular investor benchmark: S&P 500.
We explore performance over the year to date, a period of economic concern, varied outlook on rates and a narrow market breadth. Nevertheless, S&P 500 ESG Leaders has continued to show superior returns to its parent index.
Quick Reminder on Index Construction
The S&P 500 ESG Leaders index tracks the performance of the leading S&P 500 Index after a set of exclusion and ESG performance screens are applied.
Stocks are deemed ineligible for inclusion in the index on a basis of:
- negative screening on business activity
- behavioural issues
- low ESG score
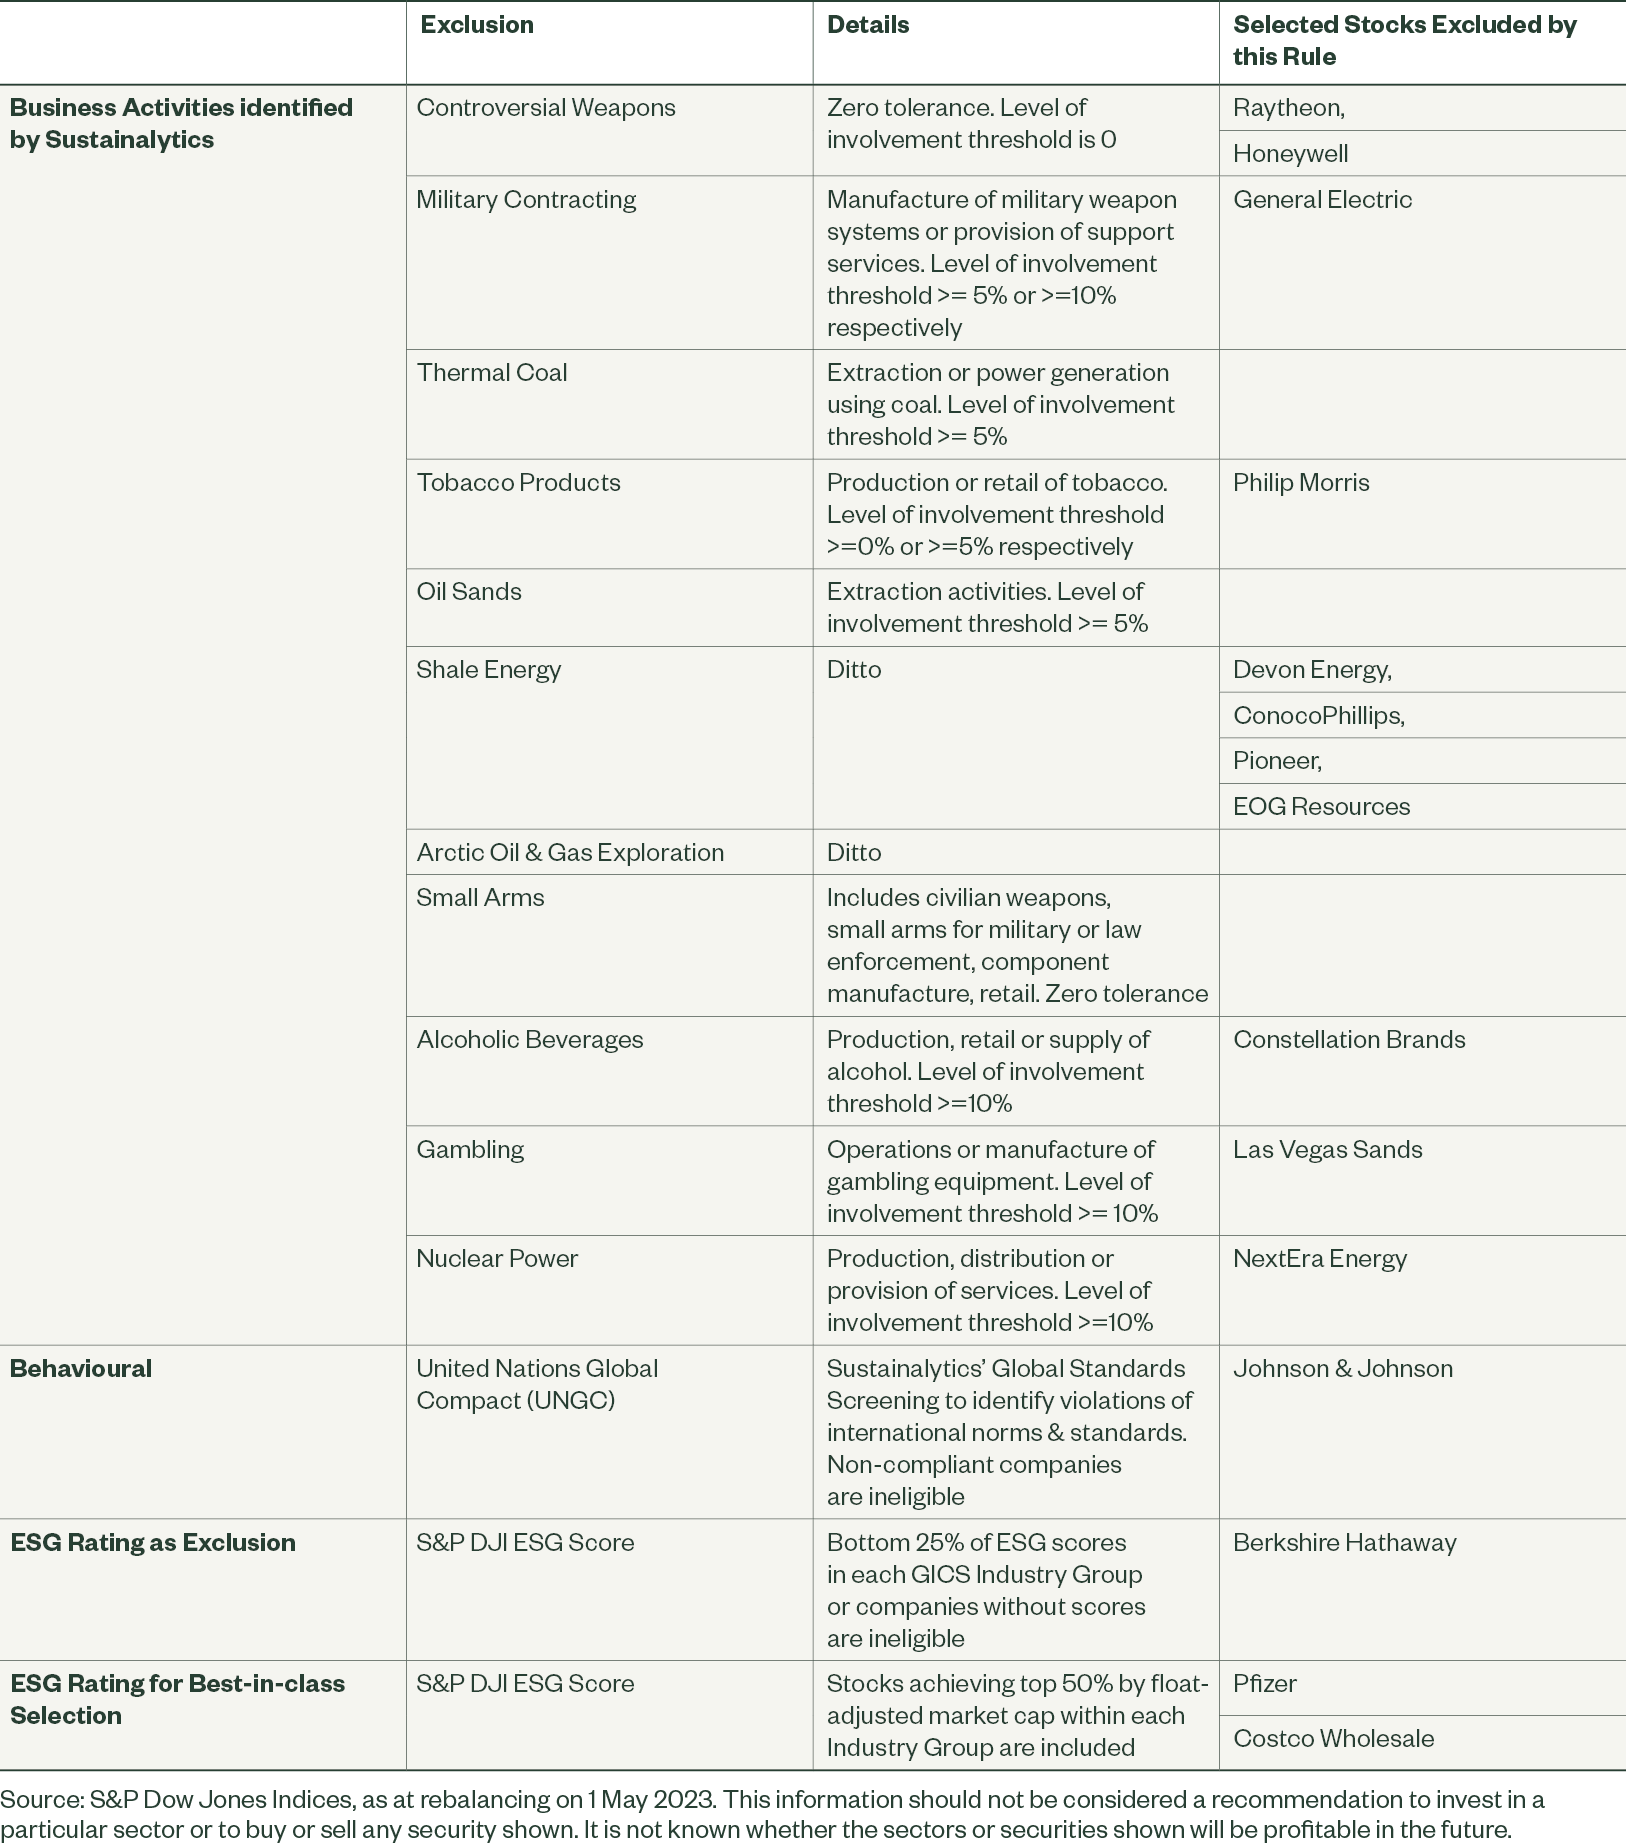
The exclusions on business activities include controversial weapons, military contracting, tobacco, alcohol, gambling, civilian firearms, nuclear power, thermal coal and unconventional oil & gas (namely Artic exploration, oil sands and fracking). Companies with disqualifying UNGC Scores are also ineligible for the index. Both sets of these exclusions are determined by Sustainalytics. For more details, please see the table at the end of this article.
Thereafter, companies with S&P DJI ESG scores in the bottom 25% of each GICS Industry Group are also excluded. S&P Global calculates these scores and derives them from their Corporate Sustainability Assessment, using either company-provided data, publicly available information, or a combination thereof. They are an aggregation of environmental, social, and governance scores that measure ESG risk and performance factors with a focus on financial materiality.
In addition, controversies are identified through Media & Stakeholder Analysis which involves daily filtering, screening, and analysis provided by RepRisk.
In order to establish the ESG best-in-class stocks for the index, the remaining (eligible) securities are ranked in descending order of their S&P DJI ESG score. They are then selected for index inclusion up to a level of the top 50% by float-adjusted market cap within each GICS Industry Group.
This methodology results in an index of just over 200 stocks, with index constituents weighted by their market capitalisation.
Results show this is working
Looking at actual and back-tested figures, the S&P 500 ESG Leaders index has achieved higher returns than the parent index in all periods featured in Figure 1. Once the slightly higher volatility is taken into account, risk-adjusted returns are very similar for the two indices. Relative performance over the last ten years can be seen in Figure. 2.
Figure 1. Risk/Return Profile of S&P 500 ESG Leaders compared with the Parent Index
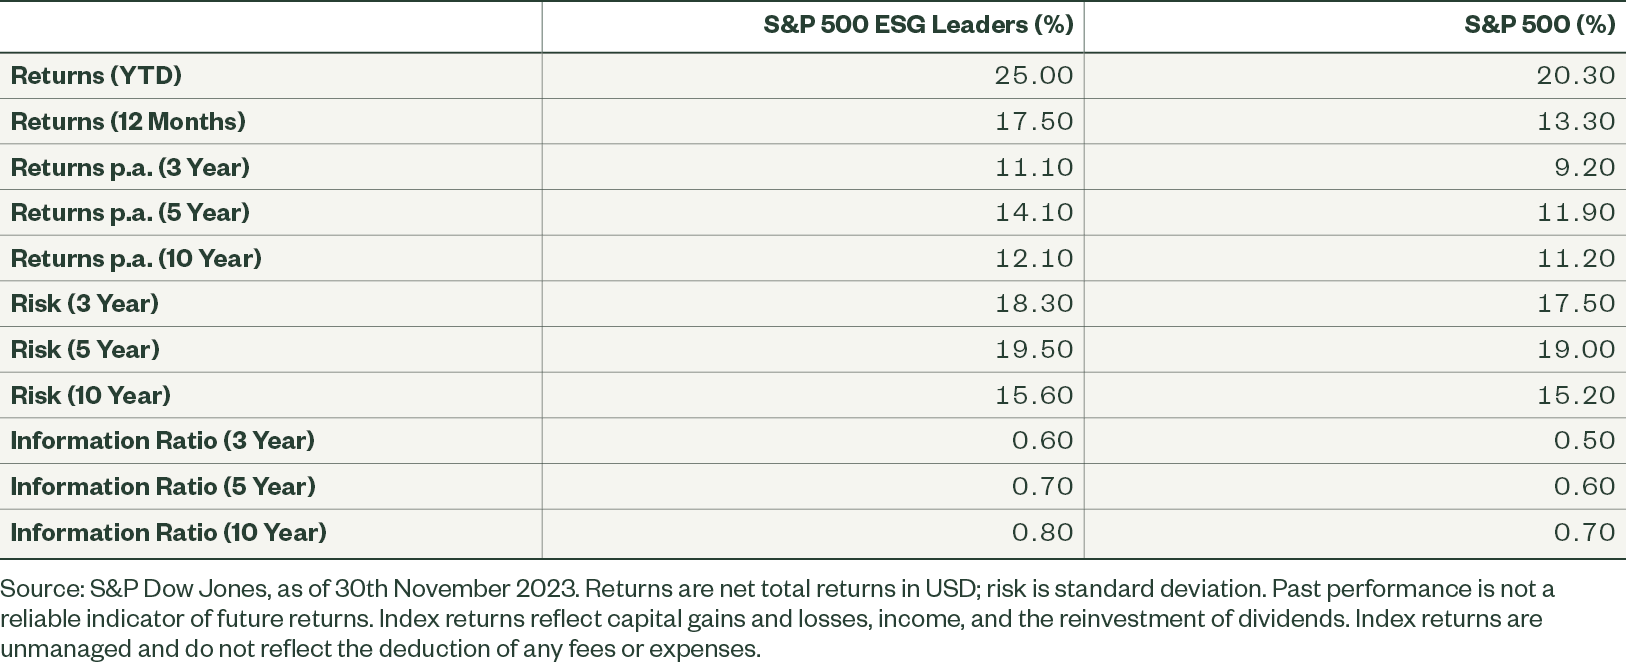
Figure 2. Ten year performance of S&P 500 ESG Leaders compared with the Parent Index
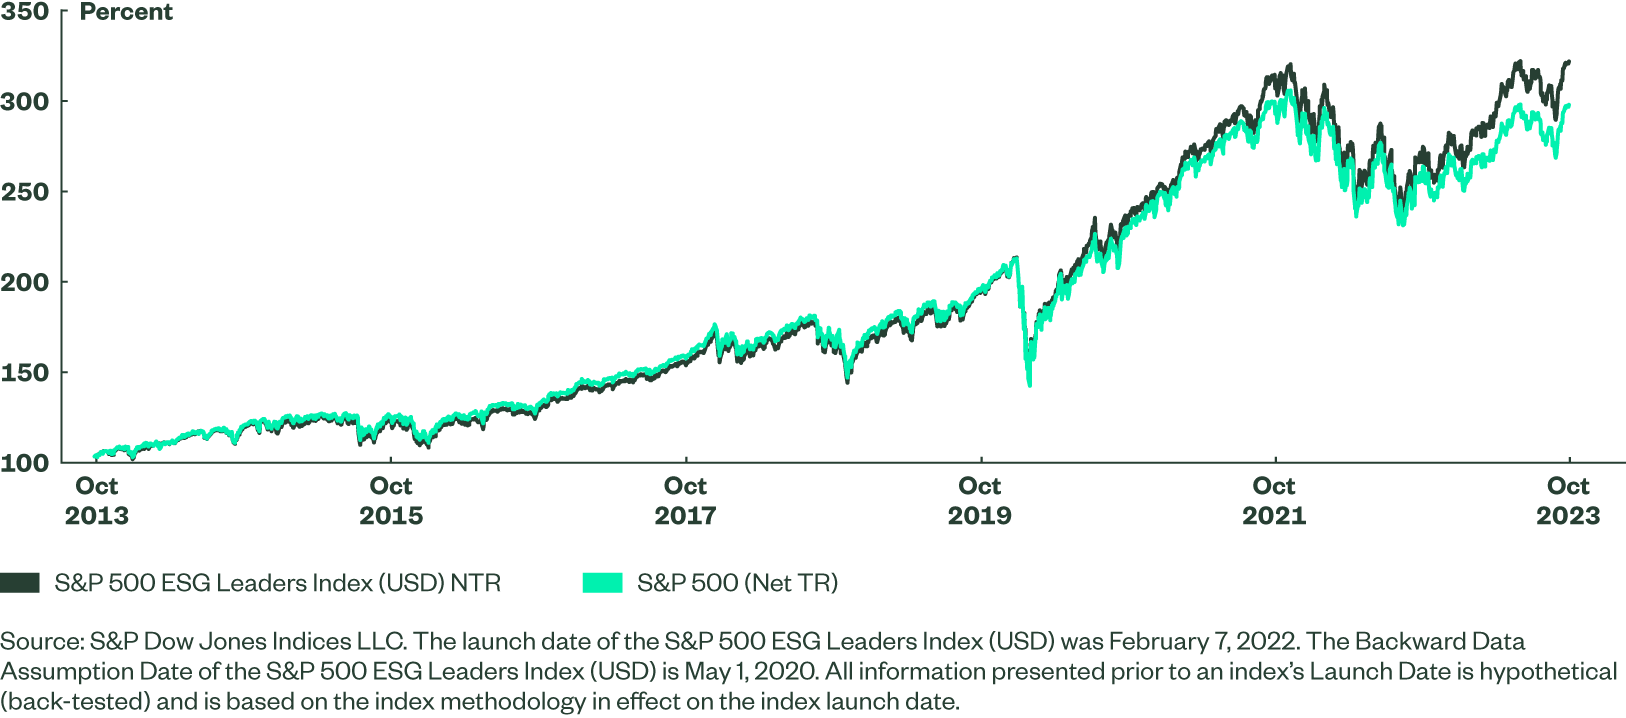
Excluding 300 stocks from the S&P 500 index could potentially have a big impact on relative performance (both positive and negative). However as mentioned above, risk-adjusted returns have been similar and the tracking error kept to approximately 2%. The exclusions have actually been beneficial to relative returns in recent years, albeit have resulted in the higher volatility of returns.
The index methodology has resulted in overweight exposure to some of the largest stocks in the market, including Alphabet, Amazon, Microsoft and Apple. This has given S&P 500 ESG Leaders index a significant performance boost year to date. These stocks, part of the Magnificent Seven, have dominated the US stock market this year on excitement over the potential for AI adoption, alongside rapid growth in cloud computing and automation.
Figure 3. Sector split of S&P 500 ESG Leaders compared with the Parent Index (%)
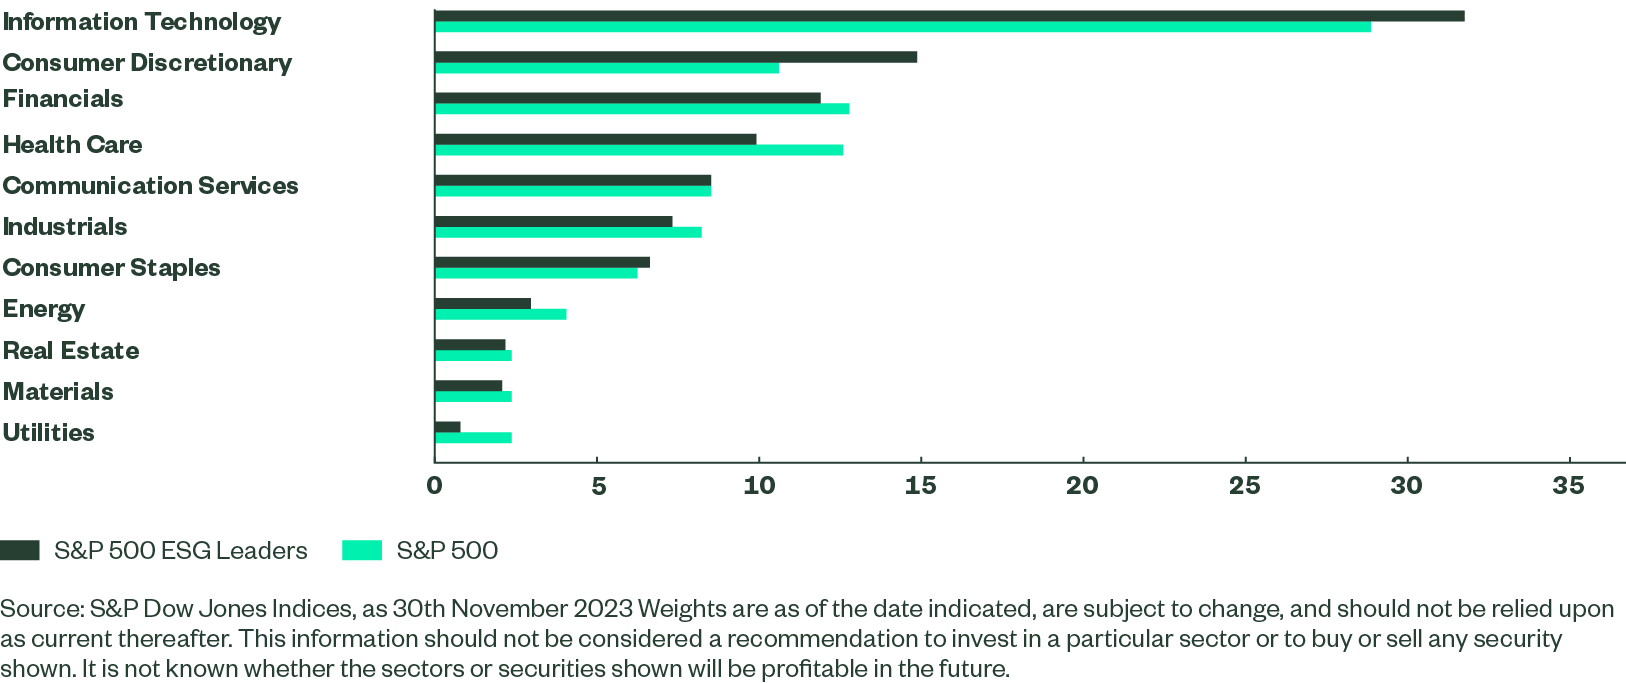
The largest sector differences between S&P 500 ESG Leaders and the S&P 500 index are the 3-4% overweight in Consumer Discretionary and Information Technology. Of the underweight exposures, the largest is -3% in Health Care.
Largest exclusions
The index is rebalanced annually at the start of May. In the most recent exercise, 29 stocks were added to S&P 500 ESG Leaders index and 27 newly excluded. The largest new exclusions this year were ExxonMobil and Eli Lilly. Both stocks were eligible in terms of activity but had a lower ESG score than other stocks in their industry groups. In Exxon’s case, the environmental score had fallen on policy management concerns which included clear air act violations, earthquakes caused by gas extraction and wastewater leakages. Competitor, Chevron, achieved a higher ESG score in its latest assessment and was added.
Amongst additions to the index in 2023 was Tesla on account of its improved S&P DJI ESG Score relative to its GICS industry group (Automobiles & Components). This was achieved after Tesla’s introduction of reporting on Scope 1,2 and 3 carbon emissions and the disclosure of information about their climate strategy. Interestingly, the stock’s previous exclusion had caused consternation amongst some investors because its important role in propelling the switch to electric vehicles.
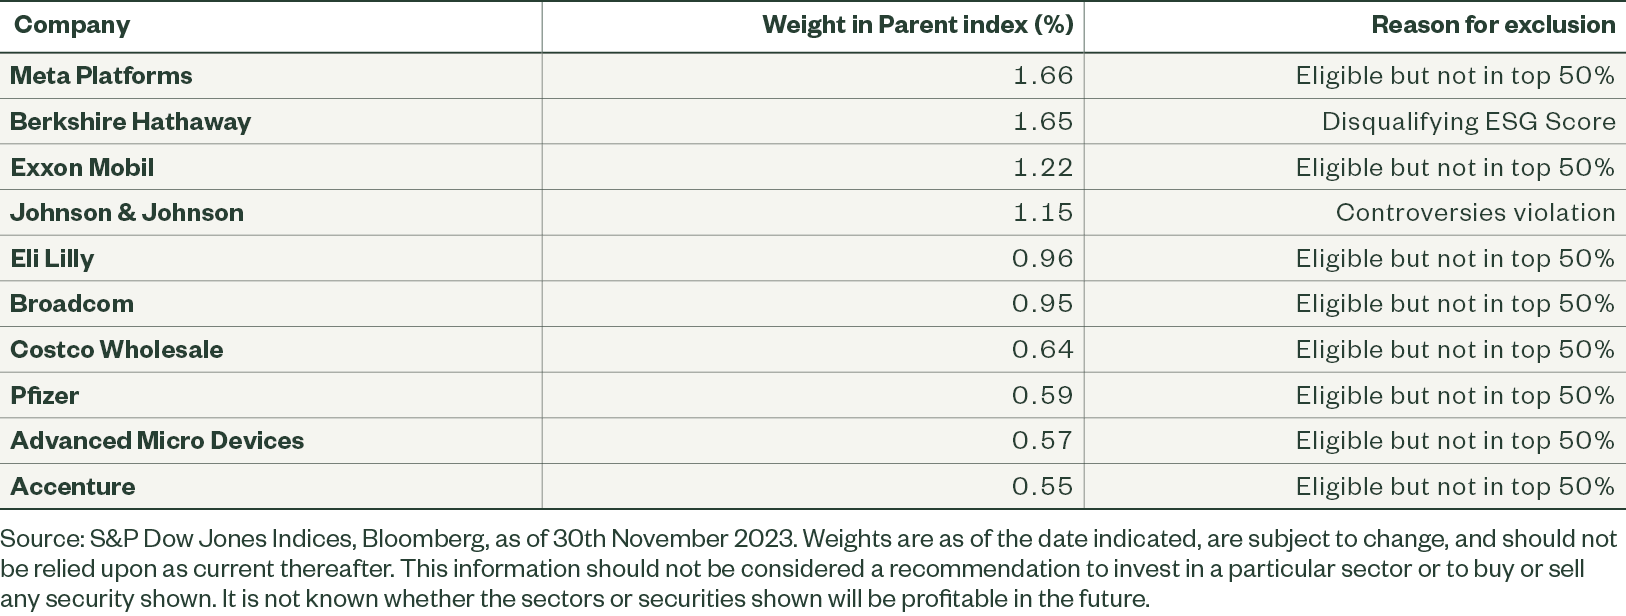
Largest 10 Stock Exclusions by weight
Exclusions by category