Equity duration matters, but earnings decide
US equities lead as strong earnings offset valuation pressure, while FX and multiple compression drag ex‑US returns. Markets are favoring earnings durability, with EM showing strong growth and attractive valuations despite global divergence.
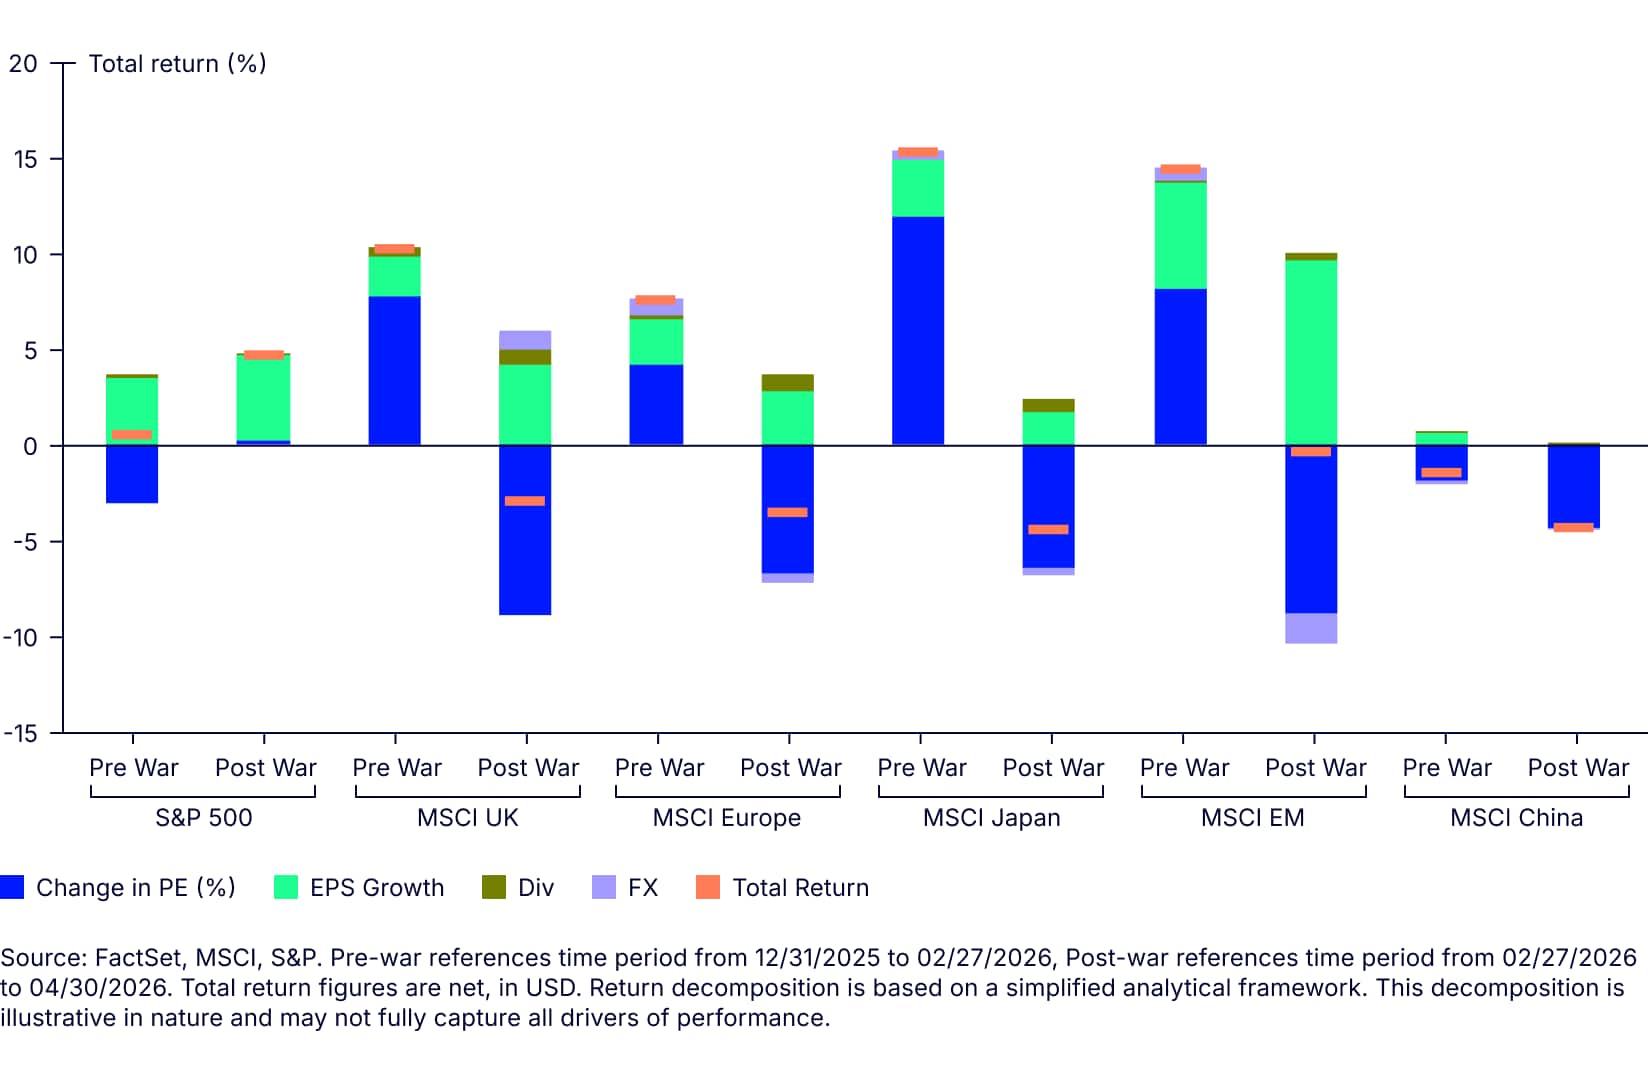
Since the onset of the war, total equity returns have fallen across most major regions, except the US. The chart below illustrates the valuation compression and FX headwinds the UK, Europe, Japan, and China have faced which has overwhelmed earnings growth. The US, by contrast, remains in positive territory, supported by resilient earnings and less severe multiple pressure, reinforcing its relative leadership in a challenging global backdrop.
Chart of the week
Return decomposition
Weekly highlights
Source: FactSet, MSCI. Data as of May 12, 2026.
Source: FactSet, MSCI. Data as of May 12, 2026.
Source: FactSet, MSCI. Data from 2/27/2026 to 4/30/2026 in USD.
Equity duration matters, but earnings decide
The shape and slope of the US Treasury yield curve convey far more than the level of yields across fixed income. Historically, the curve has been a useful barometer of the economic cycle because it reflects the dynamic between monetary policy and market expectations. As a result, the curve has long served as an indicator of how financial conditions are evolving and where economic momentum may be heading.
Real interest rates matter for equities beyond what the nominal yield curve alone implies. While equities are discounted using nominal rates applied to nominal cash flows, changes in real rates often drive equity repricing. As explored in last week’s MoM, equities also exhibit duration, with valuations especially sensitive to shifts in real discount rates, a link well documented in literature (e.g., Gormsen and Lazarus). This sensitivity varies across the market: longer‑duration equities with cash flows further in the future are more exposed to rising real rates than shorter‑duration, more cash‑generative segments.
The key distinction is why rates are moving. Increases driven by stronger growth prospects can weigh on valuations but may be offset by better earnings expectations. In contrast, rate moves driven by higher discount rates or risk premia tend to pass more directly into equity multiples. Equity performance therefore reflects the balance between cash‑flow and discounting effects.
Last week, we explored how Q1 US earnings are coming in strong. Beneath the surface, a mild growth scare has shifted leadership away from cyclical areas of the market and toward segments where margins and cash flows are more durable. Strong earnings have helped offset duration headwinds, allowing long‑duration growth leaders to outperform even in a restrictive rate environment. By contrast, shorter‑duration, more cyclical areas face a higher bar, as near‑term cash flows remain more exposed to geopolitical uncertainty. The takeaway is that while duration still matters, US equity leadership has been driven primarily by earnings durability, with markets favoring resilient cash flows over cyclical beta.
This dynamic is not only visible in the US but has reverberated through global markets. Below we expand on last week’s discussion and rank regional equity markets by their implied duration.
| Region | Duration Rank | Interpretation |
| US | Highest | High trend growth, heavy weight to tech and growth sectors, and a large share of equity value embedded in terminal cash flows. |
| China | High (variable) | Platform tech, internet, and growth segments imply long duration, but large state-linked, financial, and policy-cyclical sectors pull aggregate duration down. |
| Emerging Markets (ex-China) | Mid | Tech-heavy index composition (notably Taiwan and Korea) implies longer-duration cash flows, but higher discount rates and macro risk dampen valuation sensitivity. |
| Japan | Mid | Moderate growth, improving ROE, and ongoing earnings normalization extend duration beyond traditional “value” markets, but well below US-style growth markets. |
| Europe | Low–mid | Lower growth and front-loaded earnings reduce terminal value weight. |
| UK | Lowest | Heavy exposure to dividends, commodities, financials, and income-oriented sectors |
Source: State Street Investment Management.
Viewed through this lens, equity duration varies meaningfully across regions and equity performance is increasingly shaped by where earnings sit in the cash‑flow timeline. As we dig into regional earnings results in more detail, this duration framework helps explain why leadership can differ so sharply across geographies.
With roughly 68% of companies reported, China’s Q1 reported earnings growth stands at 6.0%, led by materials, information technology, and energy. Strength has been concentrated in industries tied to metals and mining, electronic equipment, and oil, gas, and fuel, while broader momentum remains uneven. Importantly, blended earnings growth forecasts suggest more cautious expectations for companies yet to report, pointing to a deceleration as the season progresses. Consumer discretionary has been a clear drag on results, with negative earnings growth driven by hotels, restaurants, leisure, and broadline retail. This is consistent with recent signs of weakened consumer confidence. Although China’s equity market carries long duration characteristics, it has not benefited meaningfully from the global technology tailwind reflecting its lag in leading edge semiconductor development and the fact that many domestic AI innovators remain unlisted or underrepresented in major indices. Equity performance reflects these dynamics, with Chinese equities down 3.0% year to date in local currency terms.
Earnings momentum across emerging markets excluding China has been exceptionally strong. With 60% of companies reported, earnings growth stands at 55%, far exceeding expectations and led overwhelmingly by information technology, where earnings growth has exceeded 190%, alongside solid contributions from health care, materials, and utilities. Semiconductor and hardware manufacturers have driven the bulk of this upside, with companies such as TSMC, SK Hynix, and Samsung at the center of the earnings acceleration. This tech‑led surge has translated directly into performance, most notably in South Korea, where Samsung’s market capitalization surpassed $1 trillion, helping push the KOSPI sharply higher and elevating South Korea to the seventh‑largest equity market globally. Reflecting this earnings strength and technology exposure, the MSCI Emerging Markets ex‑China Index is up 32.8% year‑to‑date. Notably, this earnings strength has coincided with attractive valuations: MSCI Emerging Markets’ PEG ratio is now at its lowest level since 2010.
In Japan, 53% of companies have reported, delivering earnings growth of 17.9% with an average surprise of roughly 8%, although outcomes are expected to become more modest as reporting progresses. Earnings strength has been broad based, led by consumer staples, financials, industrials, information technology, materials, and real estate — all reporting double digit growth thus far. Financials, in particular, are expected to see year‑over‑year earnings growth exceeding 80% as higher rates support margins, while consumer staples and materials have posted 60%+ growth among companies reported so far. These dynamics have supported equity performance, with the MSCI Japan Index up 15.2% year‑to‑date in local‑currency terms, however post-war performance has been more muted.
European earnings trends reflect a shorter‑duration profile, with growth more front‑loaded and less exposed to structural technology tailwinds. With approximately 76% of companies reported, earnings growth stands at 10.5%, driven primarily by energy and financials. Outside of these sectors, earnings growth has been mixed, with several parts of the index posting outright declines. Based on blended earnings forecasts, Europe would be experiencing negative year‑over‑year earnings growth this quarter were it not for the contribution from energy and financials, underscoring the region’s limited exposure to technology‑led earnings tailwinds. The chart below illustrates this dynamic. Earnings optimism accelerated across emerging markets, the UK, and Europe post-war where rising energy prices and commodity exposure drove meaningful upward adjustments.
The UK remains the lowest‑duration major equity market, reflected in both its sector composition and earnings drivers. With 65% of companies reported, earnings growth stands at 16.6%, but this strength is overwhelmingly concentrated in the energy sector. Energy earnings projections have improved sharply and are expected to contribute nearly 75% of total earnings growth. Outside energy, earnings momentum remains subdued, consistent with the UK’s heavy exposure to dividends, financials, and commodity‑linked sectors, where cash flows are more near‑term and cyclical. This shorter‑duration profile limits upside as growth uncertainty persists, a dynamic reflected in more modest equity performance, with the MSCI UK Index up 5.1% year‑to‑date in local‑currency terms. Our colleagues have recently highlighted the challenges facing the UK’s growth outlook, underscoring these structural constraints.
Taken together, regional earnings results suggest that duration isn’t being penalized across the board. Instead, markets are drawing a clear line between long‑duration exposure backed by tangible earnings momentum and areas where the growth story remains more aspirational. Regions with stronger technology exposure and better visibility into future cash flows have been able to push through discount‑rate headwinds, while shorter‑duration markets continue to rely more heavily on cyclical earnings delivery.
Viewed this way, real rates still matter, but they no longer appear restrictive enough on their own to cap equity upside. Rather, they represent a headwind that markets have been willing to absorb where confidence in the earnings path is high.

Go beyond the headlines...
Skimmed the summary? Dive deeper with the full PDF—your go-to for weekly market insights and analysis.