
Emerging market equities and fixed income — strong fundamentals, volatile world
Emerging market equity and local currency fixed income valuations are attractive, supported by growth data, tech opportunities, and currency moves. But geopolitics is the wildcard.
A performance turnaround
Emerging Markets (EM) equities and fixed income assets were largely out of favour with investors in the early 2020s. A stronger US dollar, inflation pressures, regulatory crackdowns in China, and geopolitical concerns weighed on both asset classes in the EM universe. But the macro and geopolitical environment has become more favourable for asset performance since 2025. The US dollar has weakened, inflation pressures eased — at least until recently — and an AI-driven rally has supported EM technology stocks, particularly in Asian countries in the vanguard of technological innovation.
The US-Iran conflict has been a source of volatility for EM assets through 2026. A sustained resolution would be supportive — but the trajectory remains uncertain.
EM’s enduring economic growth edge
Emerging economies are in the vanguard of global growth, as evidenced by data at the end of May. India has assumed the role of growth leader, with its economy expected to expand at more than 6% over the next two years.1 Growth in China is moderating but still exceeds most developed markets (DM), including the US.2 Taiwan is expected to deliver robust growth, supported by its concentrated exposure to the semiconductor industry, which underpins AI. We believe this combination of structural and cyclical drivers supports long-term EM equity earnings growth prospects. It also helps to mitigate bondholders’ credit risks.
Monetary policy is less restrictive: Firm growth, coupled with rising global inflation pressures, has caused a change in central bank policy direction. EM central banks have, on balance, been in easing mode over the last two and a half years. They are now close to neutral. Figure 3 shows that as many EM central banks are raising rates as easing policy.
Figure 3: Balance of EM central banks’ tightening-loosening policy is close to neutral
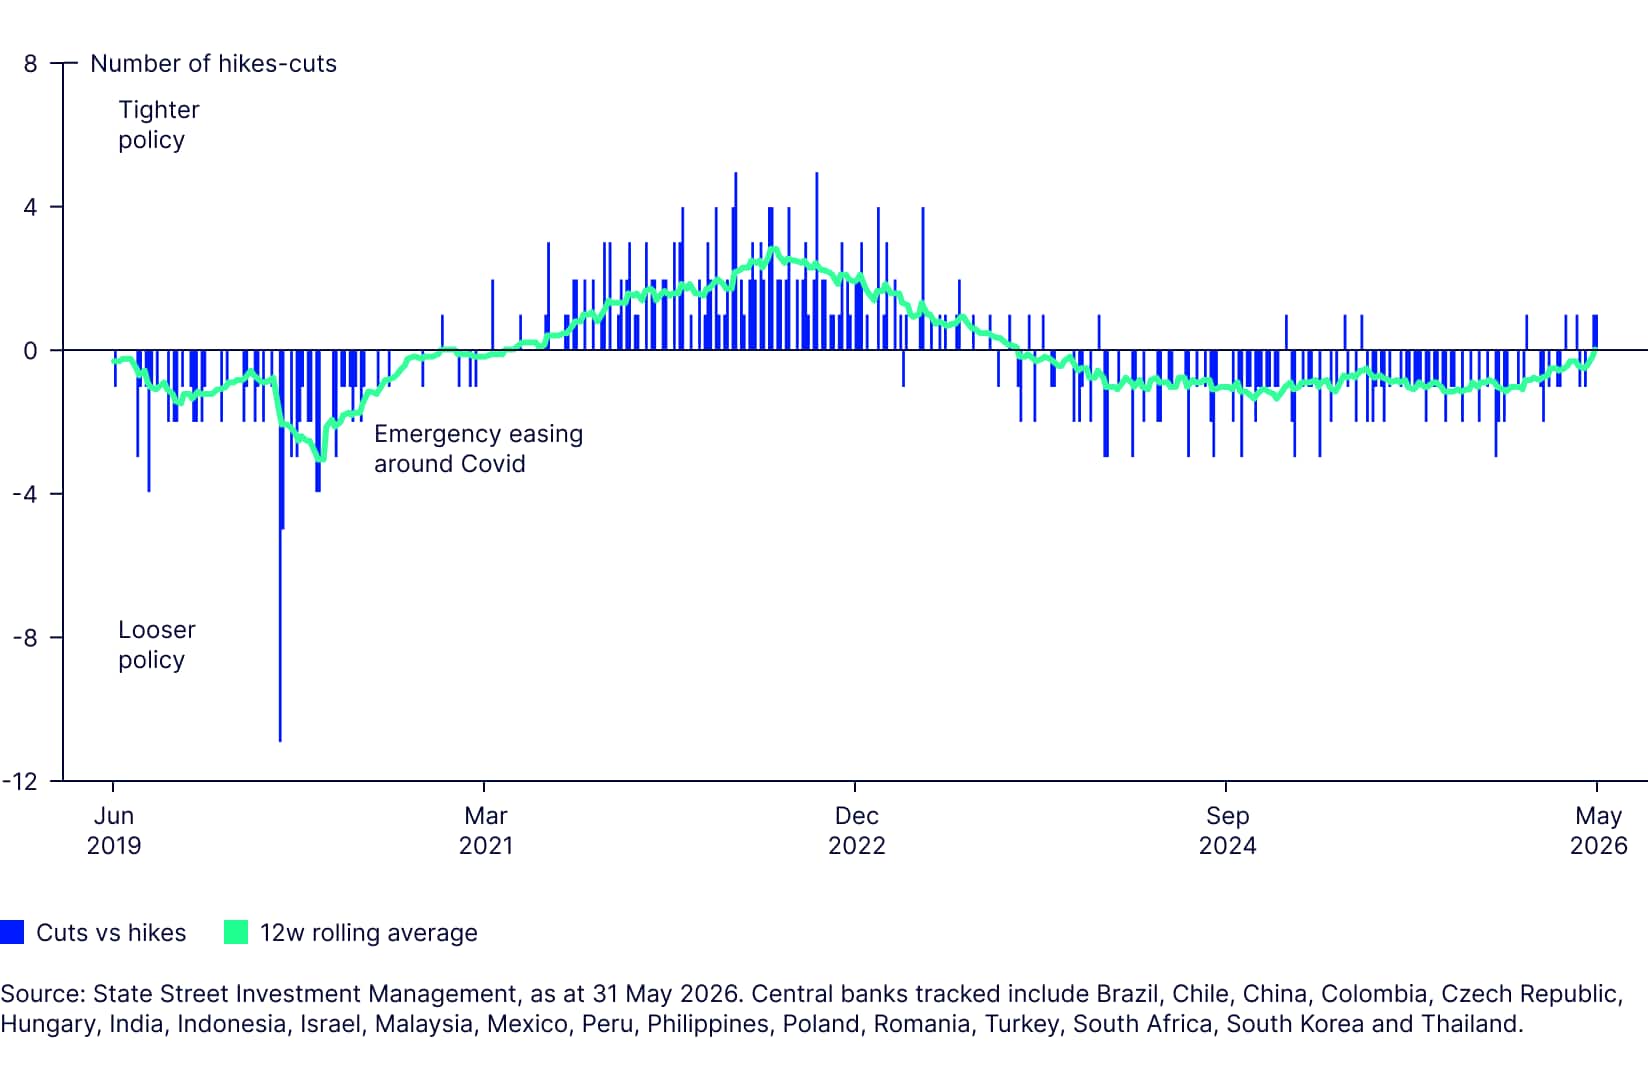
EM bond yields have risen, potentially tightening monetary conditions in the economy — but higher inflation will partly offset this. EM Consumer Price Inflation (CPI) has risen by around 100 basis points (bps) since the start of the year.3 Figure 4 shows that many EM real central bank rates have fallen recently.
EM’s currency upside?
A weaker US dollar has supported EM equity and bond performance since the start of 2025. Middle East tensions partially reversed this trend, as sentiment deteriorated and Federal Reserve (Fed) rate-cut expectations stalled. However, many key EM currencies remain weak relative to historical levels4 and we think appreciation potential persists.
Our view
Macro and currency trends suggest favourable opportunities in EM assets. Investors seeking growth exposure may favour EM equities, while those focused on competitive yields and currency opportunities may explore EM debt. Geopolitics remains a wildcard.
Equities: AI and growth drive opportunities
MSCI’s Emerging Markets Index — the most popular EM equities benchmark — offers access to fast-growing economies. It is heavily skewed towards EM Asia equities, which form around 84% of the index.5 But EM equities are powered by distinct Asia growth engines within the region:
- Chinese equities (20% of the index) provide exposure to the world’s second-largest economy. They may also serve as a diversification tool because of a relatively low historical correlation to developed markets.6
- India has taken China’s baton of economic growth leader, with expected expansion of over 6%,7 and favourable demographic trends.
- Taiwan and South Korea are embedded in the global technology supply chain, given their critical role in the semiconductor ecosystem, which underpins the AI revolution.
Overall, EM Asia economies tend to be net commodity importers, so rising prices could present a headwind. Although stocks from EMEA and LATAM only represent approximately 10% and 7% of the MSCI Emerging Market Index respectively, a relatively high proportion of these securities are commodity companies deriving revenue linked to oil or other commodities, so they may provide some commodity exposure offset.
A diversified exposure to global Tech
While attention is focused on US large-cap tech-related IPOs and valuations, emerging market equities offer greater access to AI and broader technology innovation, as measured by sector exposure. The MSCI Emerging Markets Index’s Technology sector exposure increased from 24% at the start of 2025, to 43%, as at 29 May 2026. This exceeds both the MSCI World and S&P 500’s Tech sector exposures of 31% and 39% respectively.8
We see three pillars for EM equities to access AI and broader technology innovation opportunities:
- South Korea and Taiwan have driven EM equity returns in 2026 year to date. These countries are indispensable links in the semiconductor supply chain, offering unrivaled capabilities in manufacturing and production of high bandwidth memory chips, and they underpin the AI rollout.
- China may serve as a diversification tool versus DM Tech exposure, offering an alternative, domestically driven AI ecosystem, including cost-competitive models such as DeepSeek. China tech giants such as Alibaba and Tencent may have the capacity to develop or embed AI solutions to compete with US models.
- India’s IT sector is predominantly focused on software and services, and has largely lagged the hardware-driven AI rally. However, over the longer term, the sector may be well-positioned to embed AI, and benefit from its broader implementation.
Attractive valuation multiples
Emerging market equities outperformed developed markets by 19% in the first five months of the year.9 But the MSCI EM Index 1-year forward price-to-earnings ratio (1Y Fwd P/E) has de-rated relative to developed markets, as strong earnings revisions have outpaced price gains.
In consequence, the MSCI EM trades at a 39% 1Y Fwd P/E discount to MSCI World.10 We view these multiples as attractive, given medium-term AI-driven growth prospects, and longer-term economic convergence and structural growth potential.
AI’s earnings upgrade
As Figure 9 shows, consensus expectations for 2026 earnings-per-share (EPS) growth increased from 18% in November 2025 to 50% as of end of May, significantly above the MSCI World’s 19%. AI-driven demand for semiconductors, particularly memory chips, have driven this, boosting earnings expectations for companies such as Samsung Electronics, SK Hynix, and the Taiwan Semiconductor Manufacturing Company.
Earnings upgrades and performance have been highly concentrated so far this year, which is often the case in emerging markets, where one country or sector leads in a given macro environment. Leadership, however, tends to rotate across regions and sectors over time: For example, China dominated in the late 2010s, then was a performance drag. India led the pack in 2023 and most of 2024. Brazil outperformed during the 2000s commodity boom, then fell back.
We believe that long-term investors may benefit from a broad and diversified EM equity exposure.
Risks to monitor
Emerging markets equities offer a supportive case, but investors should consider several external and internal risks.
EM equities have historically been sensitive to geopolitics. Events such as the conflict in the Middle East not only impact real economies through oil markets, but also affect investor sentiment, potentially leading to capital outflows as long as uncertainty persists.
Regulatory intervention risks, particularly in China, should be considered. A China technology-focused squeeze began in late 2020 and became an EM equity headwind. The current strategic importance of domestic technology champions may partially mitigate this risk, as China competes with the US in AI and broader technology development.
These risks should be monitored but we believe the medium-term tailwinds of strong economic growth, improving earnings, and competitive relative valuations outweigh these potential headwinds.
Gaining exposure to EM equities:
Emerging market equities can be accessed through a range of State Street Investment Management strategies:
Learn more about our range of targeted EM equity exposures, including small-cap, dividend, and enhanced Article 8 solutions here.
Further reading: Why Asia may be the biggest winner of the global AI boom
Local currency’s fixed income upside
A backdrop of firm growth and enduring inflation is not obviously constructive for bonds but EM exposures offer opportunities. EM debt yields pushed up from pre-conflict yield lows following oil-price spikes and a general risk-off sentiment, similar to US Treasurys’ path. While correlations to Treasurys have increased since the conflict local currency EM debt has a number of advantages:
- Higher yields: The yield to worst on the Bloomberg EM Local Currency Liquid Government Index was 6.34% as at the end of May11, towards the upper end of the 5.80-6.57% range seen since the start of 2024.
- Material pick-up versus Treasurys: The same index has a yield pick-up of around +200 basis points (bps) relative to US Treasurys, in the middle of the 160-245bps range seen since the Fed normalised rates.12
- Positive real yields: Inflation has risen globally, reducing real bond returns. Subtracting headline CPI from the bond yield-to-worst, the real yield on the 10Y Treasury has dropped to 65bps and on the German Bund was just 5bps by the end of May (Figure 10). The real yield on offer from emerging markets is 250bps, above its 20-year average.13
Flows into EM debt as a whole gathered momentum in January 2026 (Figure 11). The Middle East conflict curtailed appetite, though there was little evidence of widespread selling. Institute of International Finance (IIF) flows data suggests appetite to buy back into EM debt regained momentum in April.
Asia EM fixed income captured inflows in April following a poor February and March. Figure 12 shows the total returns by country from the start of March to the end of May 2026. The four worst performing bond markets were in Asia. Some high-carry exposures were protected and gained over the period, for example in LATAM markets such as Brazil and Colombia.
With much of the performance in EM debt markets related to currency, rebound potential could be strongest for countries that endured the greatest currency depreciations, most notably Indonesia, the Philippines, and South Korea.
The Bloomberg EM Local Currency Liquid Government Index has a 45% Asian exposure — excluding India14 — and we believe there is scope for further currency-driven appreciation.
Broad emerging market fixed income exposure
Euro-hedged broad EM fixed income exposure
Euro-hedged emerging markets local currency bond exposure
Further reading: Emerging market debt: Why it belongs in your investment portfolio