PriceStats®: Will Benign Inflation Trend Continue?
A look at quarterly measures of inflation, based on prices of millions of items sold by online retailers, to help investors anticipate and evaluate the impact of inflation.
Global Inflation Diverges
There has been a robust global component to the inflation trend since the pandemic. While inflation levels have been different, inflation rates have tended to move in tandem in response to a series of global shocks. This partly explains why central banks, at least in developed markets, are expected to move interest rates in tandem. But the recent divergence in annual inflation rates indicates that the global inflation component is beginning to weaken (Figure 1). While disinflation continues in the eurozone and Mexico, for example, it has paused in Australia and the US.
US Inflation Remains Firm
Seasonally, the first quarter is almost always the most robust time of year for inflation. And PriceStats recorded above-average jumps in price levels in both February and March. While some of this is related to higher transport and gasoline prices, readings were also boosted by a firmer trend in some goods prices.
It’s still too early to tell whether this represents a change in the more benign inflation trend seen in the second half of 2023. PriceStats recorded only a marginally above-average Q1 reading relative to normal seasonal trends (Figure 2). For now, this remains quite different from the much firmer trend seen in 2021. But given rate cut hopes, it will be important that inflation doesn’t deviate much further from its Q2 seasonal trend. And that will require a much softer trend in price levels, beginning this month.
Is Inflation Pressure Building?
Goods prices have been an important determinant in both inflation and disinflation trends in the past three years. Supply disruptions during the pandemic and its aftermath meant that goods prices reinforced, rather than counterbalanced, more rapid service sector inflation. While there were concerns at various points that “structural” goods price disinflation wouldn’t return, goods prices quickly returned to their pre-pandemic, disinflationary norms in the second half of 2023.
But 2024’s firmer Q1 has raised questions again about the trend. Allied to disruptions to global shipping lanes, concerns about supply disruptions, and potential shortages, a more benign trend in goods prices should not be taken for granted.
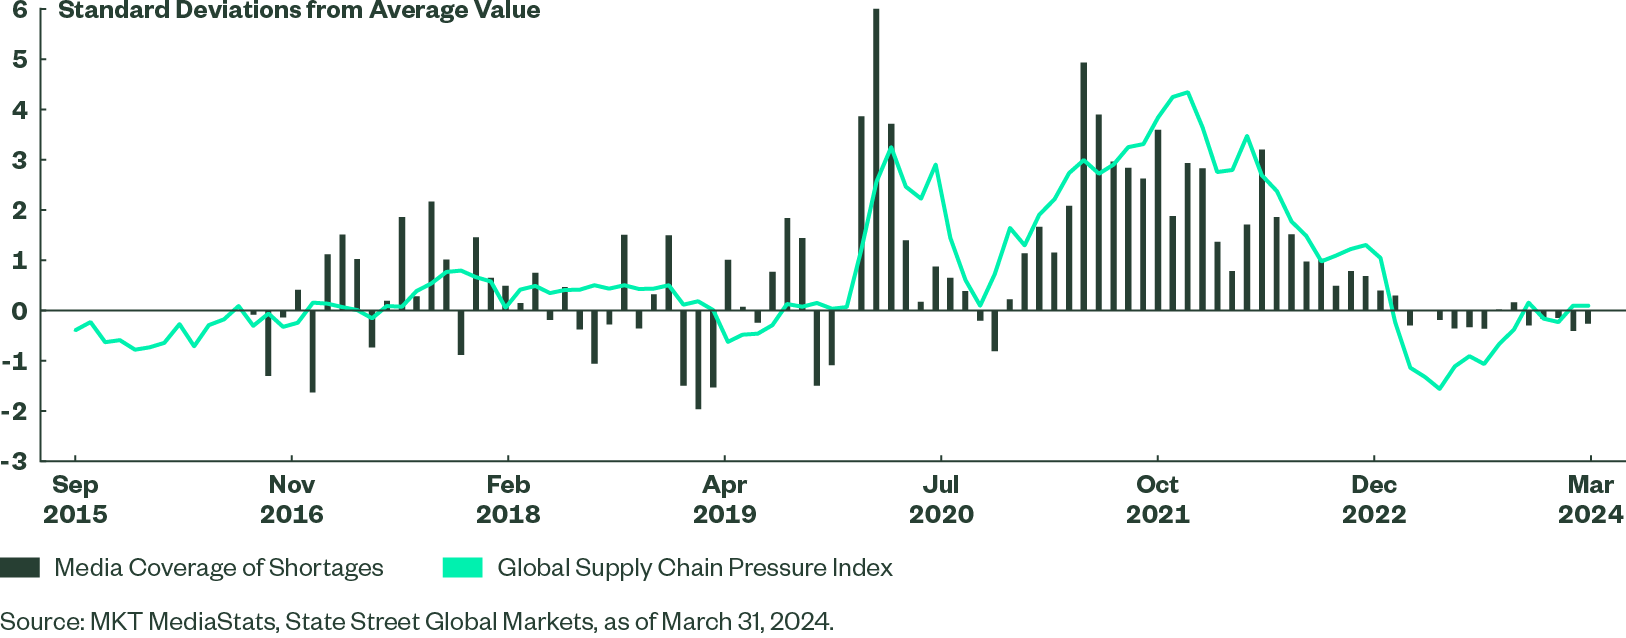
Notably, though, evidence of building supply side pressures remains modest. The New York Fed’s supply chain pressure index, which aggregates actual shipping costs alongside the prices paid and supplier delivery components of various purchasing manager indices, has risen only slightly. Meanwhile, media mentions of shortages tracked by MKT Media Stats, a State Street Global Markets research partner, also remain below recent averages (Figure 3). All else equal, this suggests it would take an unlikely reacceleration in demand to drive goods price inflation higher in Q2.
Figure 3: Trends in Supply Chain Pressures and Media Mentions of Shortages