Q1 Investment Outlook
With 2023 wrapping up on a high note for bond investors and expectation of further falls in inflation, the possibility of the US Federal Reserve (Fed) engineering a soft landing seems somewhat bright. In this speculative environment, convertibles, European fixed income markets, and focusing on the front of the investment grade credit curve for yield with long-end government exposure are looking promising.
Q1 2024
Catch the Yield While You Can
- The substantial year-end rally has left US Treasuries looking a little exposed until falling inflation validates current market pricing. Short-end US investment grade exposures still have a strong yield-to-duration trade-off. They are less exposed to issuance risk or the rebuild of term premium in the curve.
It was a wild ride for bond investors in 2023 but the year finished with a happy ending (for longs at least). Returns for the Bloomberg US Treasury Total Return Index were 3.47% in November and 3.37% in December, which ranks them as the highest and third strongest monthly returns since November 2008. The distribution of returns illustrated in Figure 1 underlines how extraordinary this performance was with only half a dozen months since the end of 2003 having registered monthly returns in excess of 3%. Given this spectacular rally in fixed income and the fact that the markets price 150 bps of cuts from the Fed in 2024, it is difficult to see the rally extending too much further during the early part of 2024.
That is not to say that the outlook for Treasuries is bearish. Fed Chairman Powell has conceded that the next move in central bank rates is likely to be lower, meaning sentiment towards the Treasury market should remain positive. Ultimately, there will need to be further evidence that price pressures are easing in order to validate current market pricing and engineer the next leg lower in yields. Until that happens, market participants are likely to buy into any meaningful sell-offs, leaving the market well supported. In addition, the start of the year will most likely see cash coming into the market.
There are also several risks to navigate. Issuance pressures are likely to remain high. US government borrowing needs remain elevated, meaning, with the Fed running its balance sheet down, domestic investors are going to have to take down significant amounts of Treasury supply. In addition, the sudden drop in yields and credit spread compression is likely to precipitate a wave of corporate issuance early in 2024 as companies rush to lock in better funding levels.
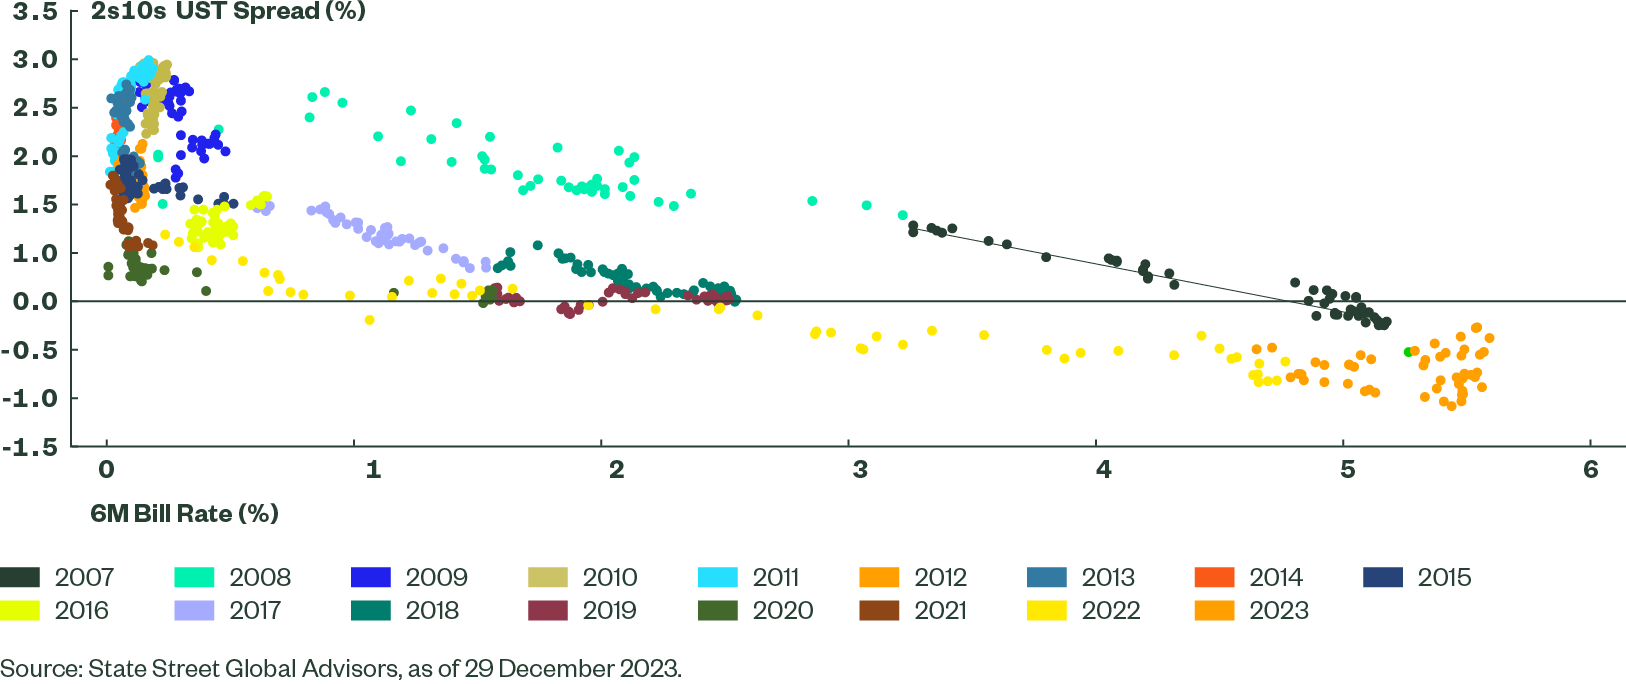
There are also risks that term premium continues to rebuild as the Fed runs down its balance sheet. As can be seen from Figure 2, which shows the 2-to-10-year Treasury slope regressed against the 6-month US Treasury Bill rate, the process of the market demanding a greater term premium got underway in 2023. The curve steepness has moved away from the regime seen post the Global Financial Crisis and back towards the levels seen in 2007/2008 prior to central bank intervention. That said, the process is not yet complete with a regression over the 2007-2008 regime indicating that, at current levels of the 6M bill rate, the 2s10s spread should be close to flat.
Figure 2: 2-year to 10-year Spread Versus Six Month Rate
Curve Steepening Back Towards 2007-2008 Levels Implies the Gradual Return of Term Premium
Focus on US Short-end, Investment Grade Credit
Overall, given current yield levels and curve shape, making the most of the higher yields available at the front end of the curve may continue to make sense. Opting for investment grade (IG) credit over Treasuries would provide some additional pick-up with a yield-to-worst for the Bloomberg US Corporate 0-3 Year index of 5.29% versus 4.31% for the Bloomberg US Treasury: 1-3 Year Index. Focusing on the front end means the yield also exceeds the 5.06% available from the Bloomberg US Corporate Bond index. Additionally, while IG credit spreads have tightened, they are relatively less tight at the front end than further out along the IG curve. They are also less extended than US High Yield spreads.1
Lastly, there is a lower level of duration risk in short dated exposures which, when combined with the yield on offer, points to a high breakeven rate for the strategy of 3.9%. In other words, market yields would have to rise by 390 bps before the price losses on the index offset the annual yield, giving investors some confidence that they can ride-out any Q1 rates volatility.
How to Play this Theme
Benefitting From a Soft Landing
- The Fed still has the ability to engineer a soft landing and this could continue to support some of the less mainstream elements of the bond market. Notably, emerging market debt can benefit from Fed policy easing as it allows local central banks to follow suit and cut rates. The crossover rating, mid-to-small-caps profile of convertibles coupled with a still relatively low delta should help convertibles.
State Street Global Advisors’ central view, as detailed in the Global Market Outlook (GMO), is that the Fed will manage to engineer a soft landing for the US economy. While the Fed is expected to have to cut rates by a substantial 150 bps, this is viewed as a way of normalising real rates as inflation falls back. This should create a positive backdrop for fixed income markets.
As long as the US economy does not completely stall, emerging market (EM) debt and convertible bonds are two strategies that performed well towards the end of 2023 and could continue to do well in 2024.
Emerging Market Debt, Real Returns
The Bloomberg EM Local Currency Liquid Index returned 11.34% in 20232, with gains heavily concentrated over the last two months of the year. The turn in the Fed’s rate cycle weakened the USD and allowed local currency bonds to rally, as higher EM exchange rates should allow EM central banks to resume their rate cutting cycles. The USD still looks over-valued against EM FX3 but, given the degree to which US rate cuts are priced in, the USD could be volatile during Q1. However, unless the USD rallies sharply, market perceptions should coalesce around the view that the easing cycle for EM central banks can resume given still tight monetary policy.
While the PriceStats alludes to the risks that inflation may prove sticky in EM countries, it is also fair to say that real rates are high. Figure 1 shows the average of the 10-year local currency bond yields for the countries within the Bloomberg EM Local Currency Liquid Index deflated by their domestic headline CPI rates. This shows an average weighted inflation adjusted return of 1.6%. This compares favourably with developed markets where the equivalent US real rate is 77 bps and for Germany is -28 bps.
This is significant for two reasons. Firstly, positive real returns are important for investors and these are now back above the 20-year average for this index. Secondly, it provides an indication that monetary conditions are restrictive, which could give some comfort to central banks that policy is bearing down on domestically generated price pressures.
Convertible Bonds Benefit From Twin Supports
The Refinitiv Qualified Global Convertible Index returned 13.25% in 20234, as the turn in the Fed rate cycle coincided with the year-end equity rally. This makes sense in the context that expectations of falling central bank rates should benefit the bond element of convertibles, while the prospect that the economy slows but does not contract should support investor risk appetite.
Returns were also strong in 2019 when the US rate cycle turned and there are several factors that play to the view that convertible bonds can continue to do well.
- The small/mid-cap profile of issuers, which accounts for circa 35%-40% of the Refinitiv Qualified Global Convertible Index, is higher than most global equity indices and should allow for gains to continue as rates fall, as long as there is no meaningful recession. The profile of issuers in the index is also skewed towards technology (28.9%) and communication services (15.1%), which allows it to participate in the still burgeoning AI theme.
- Valuations remain balanced with the Refinitiv Qualified Global Convertible Bond Index delta standing at around 44 at the end of December. This is up from 35 as of end October but remains a balanced profile: historically, performance over the following 12 months has been positive, on average, when deltas have been in this range.
- The short duration, potential equity upside and a crossover credit profile can benefit if the economic backdrop favours risk assets. However, in a hard landing scenario the relatively balanced profile and still low bond floor (around 16% as of 29 December 2023) can act as a protection for broad allocation portfolios.
There are some risks from new issuance. This is expected to increase from approximately USD 80B in 2023 to USD 90-100B in 2024 given a significant portion of pandemic-era deals are nearing maturity. Their profile means convertible bonds are uniquely qualified to help borrowers trim interest expenses. Additional supply is a broad market risk but can also offer opportunities for interesting deals.
How to Play this Theme
Sticking to a Barbell Strategy
- European fixed income markets can continue to benefit from weak growth and falling inflation, which means taking on some duration. Focusing on the front of the investment grade (IG) credit curve for yield with long-end government exposure to add duration and convexity continues to appeal.
The final quarter of 2023 was a strong one for European fixed income markets, with the decline in inflation against a backdrop of weak growth causing the market to start pricing in cuts for both the European Central Bank (ECB) and the Bank of England (BoE). In addition, credit spreads tightened in both the IG and high-yield markets as well as in the government space where 10Y Italian BTP spreads to the German Bund contracted by around 30 bps.
A theme from the Q4 2023 Bond Compass was to approach European bond markets through a barbell structure, using short maturity IG credit as a way to boost portfolio yield while adding duration risk through long-end government bonds. This worked well, as duration risk was broadly aligned with the all curve government exposure — but returns for the quarter were around 8 bps higher in euros and 45 bps greater in GBP portfolios compared to returns from the all curve government index. The outperformance was even more marked versus all curve IG credit funds.5
Staying the Course
The weakness of the economic data in both the Euro region and UK suggests a real chance that European central banks may be forced into a more dovish positioning. This means being neutral to long duration. However, maintaining this barbell structure for portfolios rather than owning all curve exposure makes sense for several reasons.
- The ‘belly’ or middle part of the curve continues to look expensive. Figure 1 shows the barbell of the yield of the all curve exposure less half of the yield of the short and long ends of the government curves. Both look close to the lower end of the 10-year range, suggesting that the middle part of the curve is expensive.
- There are risks to the belly of the curve from heavy supply at the start of year and from the return of market ‘term premium’. While the rebuild of term premium is also a risk for the long end of the curve, historical analysis of the curve shape suggests there are greater risks for the belly. Along the German curve, the last time front-end yields were at similar levels was in 2008. A plot of the 10Y to 30Y slope against the 2Y rate suggests that if the curve was to revert to a shape similar to what was seen in 2008, then the 10s30s slope needs to steepen a further 34 bps from end of 2023 levels. Undertaking a similar analysis for the 2Y to 10Y part of the curve versus the 1Y rate suggests a steepening of over 110 bps is required. This is only a rough approximation of the term premium that may be expected if the ECB continues to unwind its balance sheet, but it highlights the more extreme risks of steepening along the first 10 years of the curve as opposed to in the longer maturities.
- Structuring a fixed income portfolio as a barbell results in a greater level of convexity than you get if you have exposure to the whole curve.6 Given the desirable properties of convexity — most notably that a more convex bond sees faster price increases than a less convex one (assuming durations are equal) for the same decline in yields — it makes sense to maximise convexity in an environment where yields are expected to decline.