
Investment Outlook
AI investment and geopolitics are reshaping global equity markets, driving volatility and increasing dispersion across regions, sectors, and factors. In this environment, investors should consider balancing selective exposure to structural growth opportunities against geopolitical headwinds, while maintaining diversification.
Within developed markets, the US appears well-positioned to capitalise on AI-led growth. The AI investment cycle may provide a growth impulse for the broader US economy, and the focus is likely to gradually expand from AI infrastructure providers and technology enablers to a broader range of companies benefiting from enhanced productivity.
Geopolitical tensions and ongoing deglobalisation are encouraging a reshoring of US capital investment, with greater focus on building domestic manufacturing capabilities and supply chains. The US economy is also relatively insulated from geopolitically driven commodity shocks.
This combination of AI leadership, a renewed investment cycle, and geopolitical resilience is evident in the US macro backdrop, with 2026 GDP growth expected to reach 2.1%, compared with 0.6% in both Japan and the Eurozone.1 Manufacturing surveys tell a similar story: the S&P Global US Manufacturing Purchasing Managers’ Index (PMI) stood at 53.9 in June, versus 51.4 for the Eurozone equivalent.2 The US labour market remains stable, with unemployment at 4.2% in June.3
Equity market performance rarely moves in lockstep with economic data, but this underlying resilience may provide a supportive backdrop for earnings growth and reinforces the case for allocating risk towards a region that has demonstrated relative strength.
The unevenness of economic growth within the developed world may prompt investors to favour US exposures with a domestic tilt, as US gross private domestic investment is expected to grow by 3.6% to 3.9% per year from 2026 to 2028.4
Against this backdrop, US small- and mid-cap equities may offer a more direct way to access domestic strength, as they derive a larger share of revenue from the US economy than their large-cap counterparts. As a result, they may be well placed to benefit from a resilient economic backdrop and an expanding investment cycle.
The Russell 2000 Index and the S&P MidCap 400 Index have outperformed the S&P 500 by 12 and 7 percentage points year to date, respectively, despite an environment of rising yields.5
Small- and mid-caps have so far absorbed rising yields, as a robust US economy provides room for revenue expansion. This is reflected in 2026 earnings growth forecasts of 48% for the Russell 2000 and 22% for the S&P MidCap 400.6
In addition, mid-caps trade at less demanding price-to-earnings (P/E) multiples than large caps, offering a combination of lower valuations and robust earnings growth potential. The valuation picture of US small caps is more nuanced, as a significant share of constituents is not currently profitable. However, viewed in a 10-year context (Figure 3), small-cap multiples on this basis remain well below those of large caps.
Valuation multiples have played a relatively limited role in driving markets since the pandemic, but in 2026 investors have so far placed greater emphasis on P/E levels. In the first two months of the year, US small-cap stocks and cyclical sectors such as Materials and Industrials outperformed US Technology stocks, reflecting concerns over the latter’s elevated P/E multiples.
That trend reversed in the second quarter. By then, however, technology valuation multiples had compressed due to relatively weak performance and upward revisions to earnings estimates, setting up the subsequent rally in Technology stocks.7 Market moves in the first half of the year suggest that investors have been seeking value opportunities within sectors, rather than limiting their focus to traditionally discounted segments of the market.
Investors seeking value exposure without reducing their allocation to fast-growing sectors, such as Technology, may consider the sector-neutral MSCI USA Value Exposure Select Index. The index gained 25% in the first half of 2026, outperforming the MSCI USA Index and the standard MSCI USA Value Index by 15.6 and 15.1 percentage points, respectively.8
Meanwhile, the index’s forward P/E ratio remains attractive at 11.1x, compared with 20.7x for the MSCI USA Index,9 while the index maintains an Information Technology allocation of 38%, broadly in line with the parent benchmark.10 In addition, the MSCI USA Value Exposure Select Index incorporates a modest quality overlay, helping to filter out companies that may be “cheap for a reason”.
The MSCI USA Value Exposure Select Index may be the preferred option for investors expecting a higher rate environment, while small caps, which have so far absorbed modest yield rises, may offer greater potential upside if inflation pressures moderate. For investors seeking both exposures, the MSCI USA Small Cap Value Weighted Index blends domestically-oriented, cyclical small-cap exposure with a strong value tilt.
Implementation Ideas:
Equity indexes remain heavily concentrated, a potential source of market fragility. The top 10 constituents account for 36% of the S&P 500 Index, while the US represents 72% of the MSCI World Index.11 Although the outlook for US markets remains constructive, diversification remains a prudent consideration for investors.
However, developed markets outside the US, including Europe and Japan, present subdued growth prospects, and equity valuations in those regions do not appear compelling alongside relatively moderate earnings growth expectations.12
Emerging market equities, in contrast, offer potential diversification benefits and combine stronger growth prospects with relatively attractive valuations. The MSCI EM Index is heavily weighted towards EM Asia, which accounts for 84% of the benchmark,13 providing an effective counterweight to a US-dominated global equity allocation. EM Asia also offers one of the most direct routes into the AI theme.
Sustained demand for semiconductors has fuelled earnings growth across emerging markets, which is expected to reach nearly 50% in 2026.14 This demand shows few signs of moderating, and emerging markets earnings growth is expected to remain strong into 2027, albeit at a slower pace (see Figure 5).
Figure 5: Forecasted EPS growth and valuation multiples
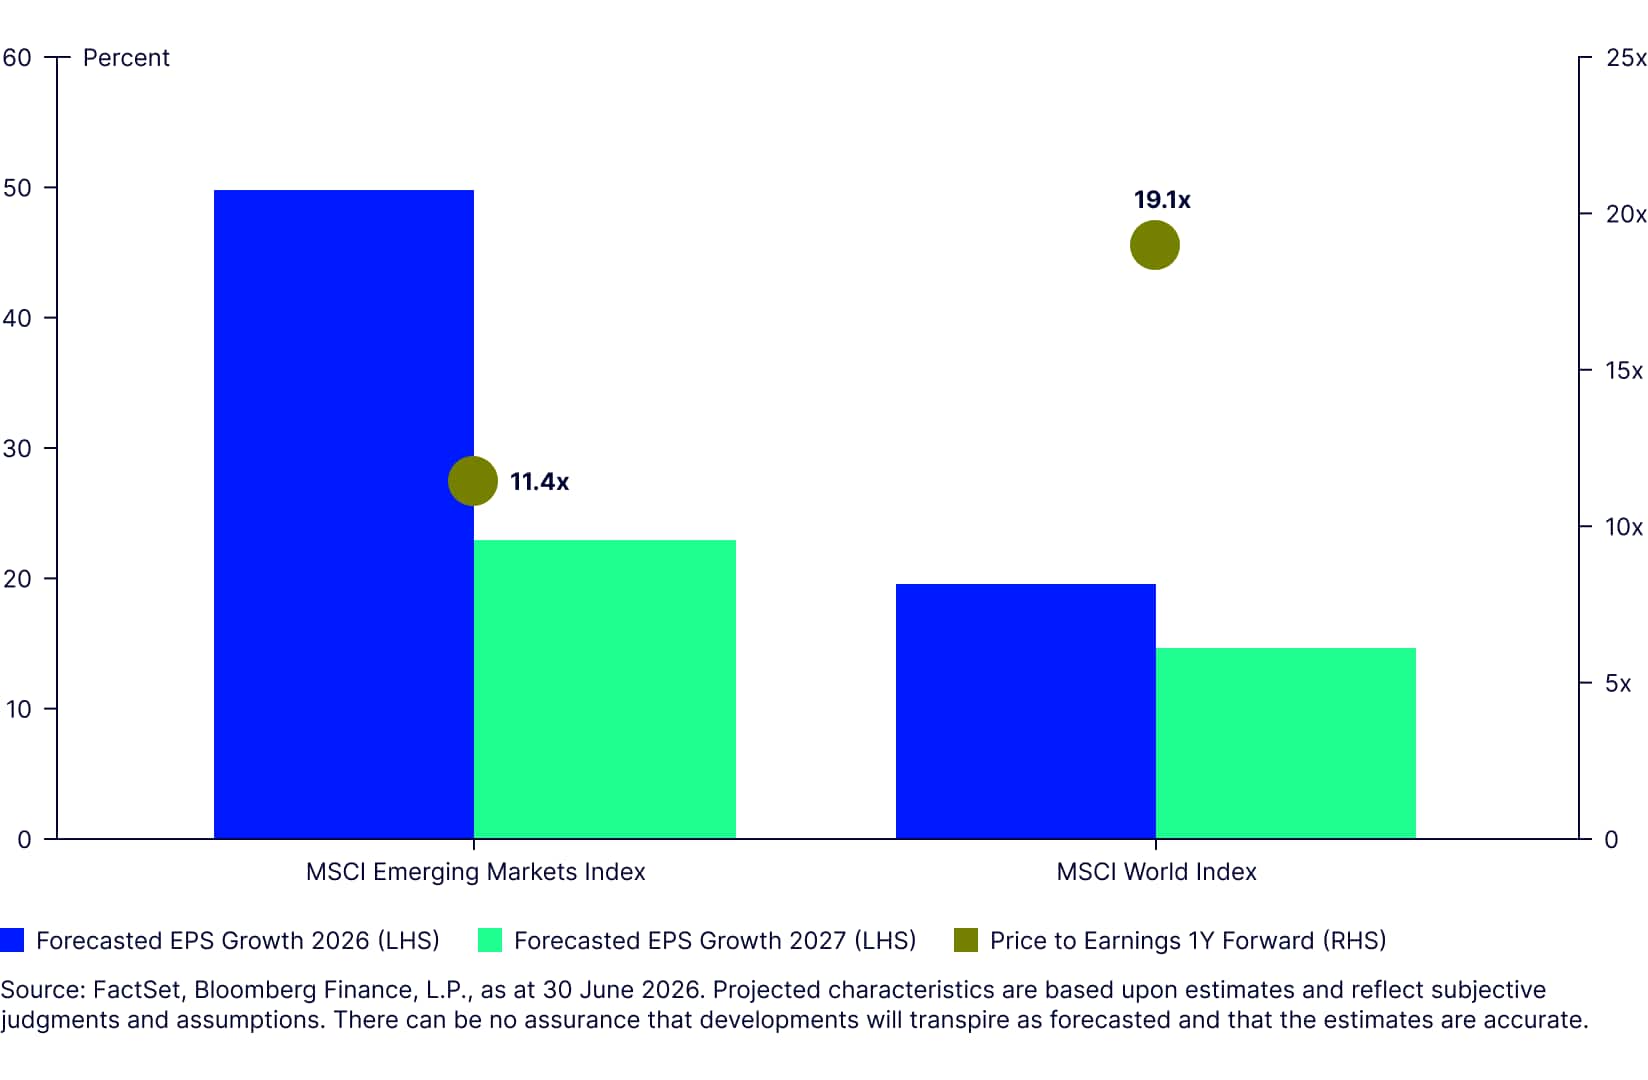
Taiwan and South Korea, which account for 27% and 24% of the MSCI EM Index, respectively, and are global leaders in the semiconductor and hardware industries,15 are driving much of this earnings growth. Over the longer term, however, the EM growth story extends well beyond AI.
Emerging markets remain a key driver of global economic expansion, with growth rates generally exceeding those of developed markets. India stands out as a structural growth leader, while China, despite its economic slowdown, continues to expand at a faster pace than most developed economies, including the US.
Broader structural trends underpin EM growth. Favourable demographics in markets such as India, urbanization, and rising consumer spending all support growth. Companies in Latin America and the Middle East provide additional diversification through their exposure to commodity-related sectors.
This diverse set of growth drivers, from technology and manufacturing to consumption, reinforces EM’s potential as a strong portfolio diversifier. It provides exposure to faster-growing economies at a time when developed market growth remains, with the exception of the US, relatively constrained.
EM’s large- and mid-cap companies may help reduce US large-cap concentration risk, but the MSCI EM Index is itself concentrated. The top 10 constituents represent 40% of the benchmark,16 and, in the short term, the exposure remains sensitive to AI-related dynamics. Against this backdrop, EM small-cap equities may offer a differentiated and diversified way to access the emerging markets growth story. The top 10 companies account for less than 7% of the MSCI EM Small Cap Index.17
While EM small caps retain exposure to technology and innovation, they are less reliant on the largest semiconductor and internet companies, providing more balanced access to local consumption trends and domestic economic activity. With an overweight allocation to India, and only a 9% allocation to China, they combine growth potential with diversification benefits.
Implementation Ideas:
Europe appears less well-positioned than the US to benefit from AI-driven growth, and its dependence on imported resources leaves it more exposed to geopolitical fragmentation, weighing on structural growth prospects. Any durable easing of Middle East tensions may provide near-term support for European equities through lower energy costs and valuation re-rating, but the region continues to face longer-term constraints on earnings growth.
The same geopolitical headwind, however, creates selective opportunities within European equities. The threat from Russia, longer-term instability in the Middle East and increased pressure from the United States for European countries to strengthen their defence capabilities are supporting a multi-year increase in defence spending. Governments across the region have already raised military budgets and expected to progress towards their stated spending commitments.
Initiatives such as ReArm Europe, including the Security Action for Europe (SAFE) financing programme, fiscal flexibility and reallocation of EU funds, are all likely to benefit European defence and defence-adjacent companies. Policymakers increasingly view local manufacturing not only as an economic objective but also as a strategic necessity, reflecting the need for greater self-sufficiency in an increasingly fragmented geopolitical environment.
While traditional military equipment and munitions remain central to spending plans, investment is also likely to extend to cyber security, communications infrastructure, drones, and advanced defence technologies.Beyond defence, higher fiscal spending, particularly in Germany, could support infrastructure development and create a long-term tailwind for industrial companies, even as other cyclical sectors in Europe appear less compelling.
In this context, the European defence and broader industrials sectors represent growth opportunities within an otherwise low-growth European equity market. The recent underperformance of defence companies appears to reflect short-term factors such as elevated valuations after the 2025 rally and idiosyncratic, contract-specific developments such as Germany’s decision to cancel the F126 frigate programme, rather than a deterioration in the long-term investment case. With the sector’s structural growth drivers intact, the pullback may present an opportunity for long-term investors.
European Health Care: vital signs?
For investors cautious about the European growth outlook, European Health Care may offer a defensive alternative. The sector provides access to established, non-cyclical businesses, yet trades at a 4% P/E premium to the broader market, compared with its 10-year average of approximately 17%.18
The Europe Health Care sector includes several global industry leaders, and constituents of the MSCI Europe Health Care Index generate approximately 71% of their revenues outside Europe.19 As a result, their earnings are less reliant on the relatively slow European economy. The sector may also stand to benefit from AI adoption, particularly in drug discovery, clinical trial optimisation and manufacturing efficiency.
Individual pharmaceutical and biotechnology companies often face company-specific risks, including research and development outcomes, patent expirations, product concentration, and litigation. A broad sector ETF exposure can help diversify these idiosyncratic risks while maintaining access to the sector's structural growth drivers.
Implementation Ideas: