
What's wacky about your WACI?
Introduction
In recent years, some investors with climate-related objectives have adopted portfolio decarbonization goals.1,2 Often, such portfolios target metrics such as the weighted average carbon intensity (WACI), carbon footprint, financed emissions intensity, and others. With the adoption of such targets, investors may wish to better understand the drivers of change in the targeted portfolio emissions metrics against the benchmark at a given point in time or over a period of time. While it may be easy to assume that changes in the portfolio WACI come from the actual and absolute emissions by the underlying portfolio companies, other drivers could include normalization factors, market movements, and portfolio turnover.
Some methodological approaches have been developed in the industry to help attribute these changes in portfolio metrics.3 In this article, we utilize one such emissions attribution framework,4 and apply it to three commonly used equity and fixed income indexes to understand the drivers of WACI change over a three-year period between December 2022 and December 2025.5 We also demonstrate how this framework can be extended to analyze the WACI drivers at a sectoral level.
Global greenhouse gas (GHG) and WACI trends
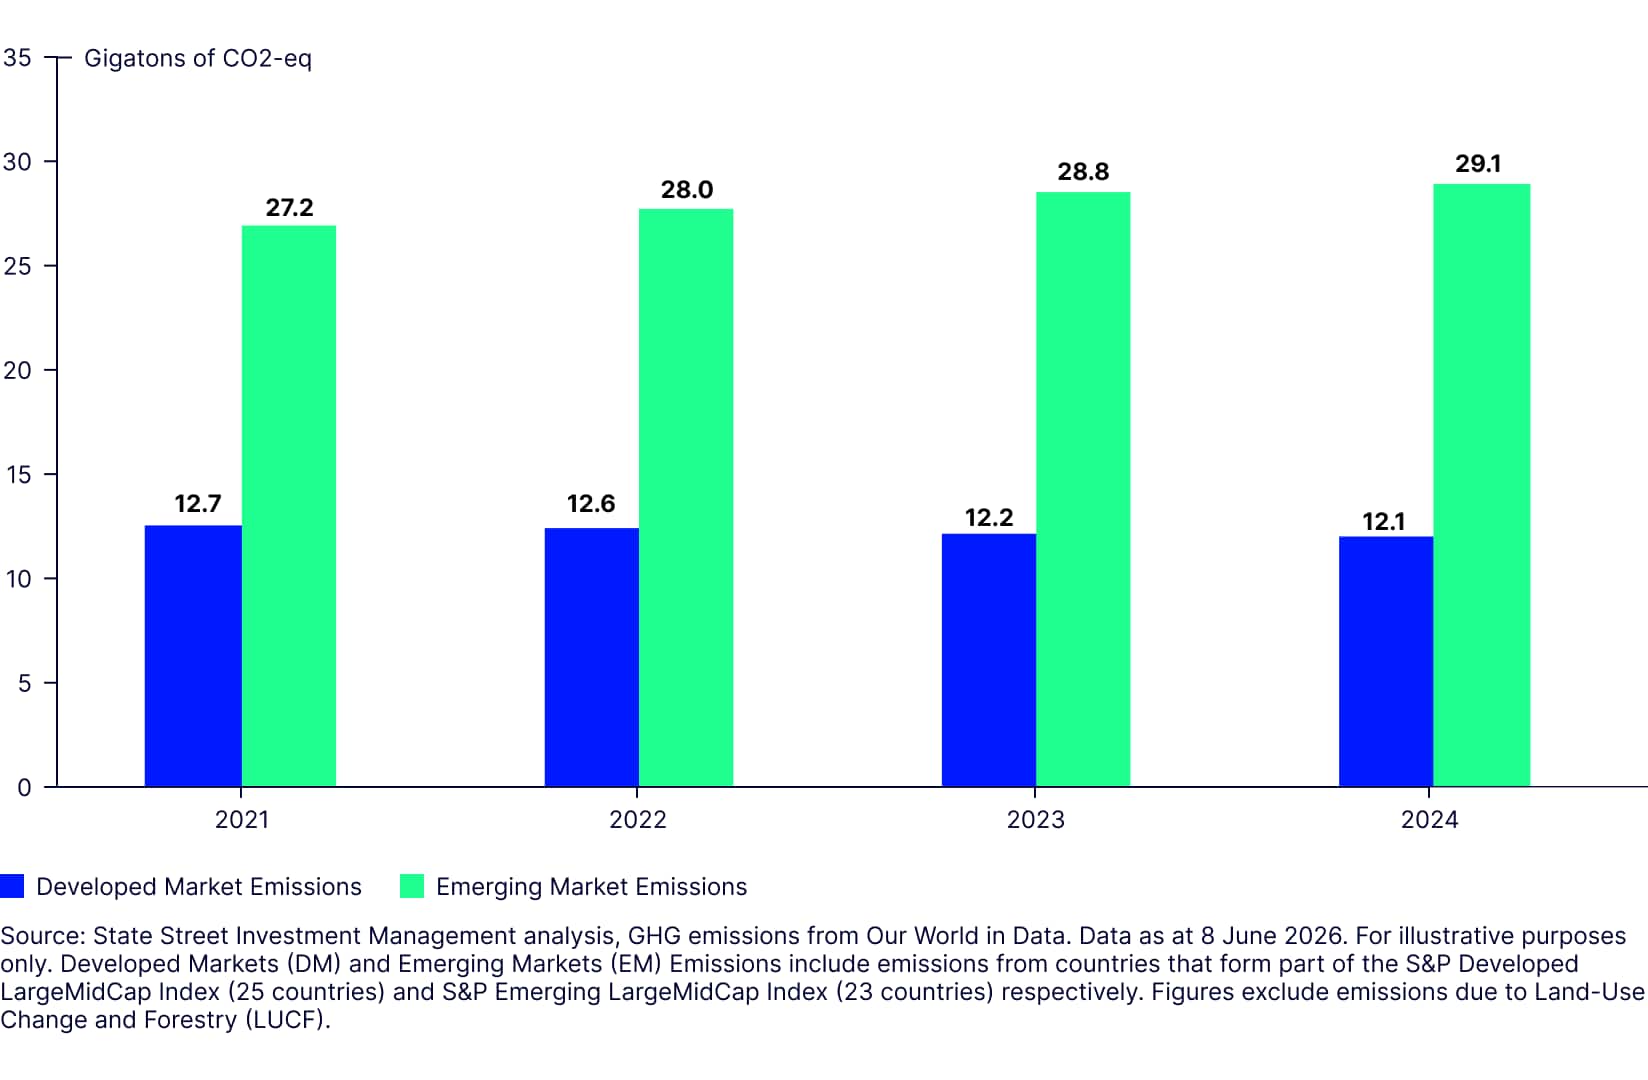
First, we look at broad trends in global GHG emissions over the recent years where data is available. We observe that aggregate GHG emissions (excl. LUCF6) from developed market (DM) countries have declined approximately 4.6% from the year 2021 to 2024 based on emissions from Our World in Data.7 On the other hand, aggregate emissions from emerging market (EM) countries have increased by 7.1% over that same period.
Figure 1: Total GHG emissions by developed and emerging markets (Gt CO2e)
Turning to investable indexes, Figure 2 shows the weighted average carbon intensity (Scope 1 and 2 normalized by revenues)8 of selected indexes. In particular, we find that between December 2022 and December 2025, based on emissions data from ISS:
- S&P Developed LargeMidCap Index’s WACI reduced from 162.5 to 85.9, a reduction of 47.1%;
- S&P Emerging LargeMidCap Index’s WACI reduced from 455.9 to 324.7, a reduction of 28.8%;
- Bloomberg Global Aggregate Corporate Bond Index’s WACI reduced from 229.7 to 179.4, a reduction of 21.9%.
Figure 2: Index weighted average carbon intensity, December 2022 to December 2025
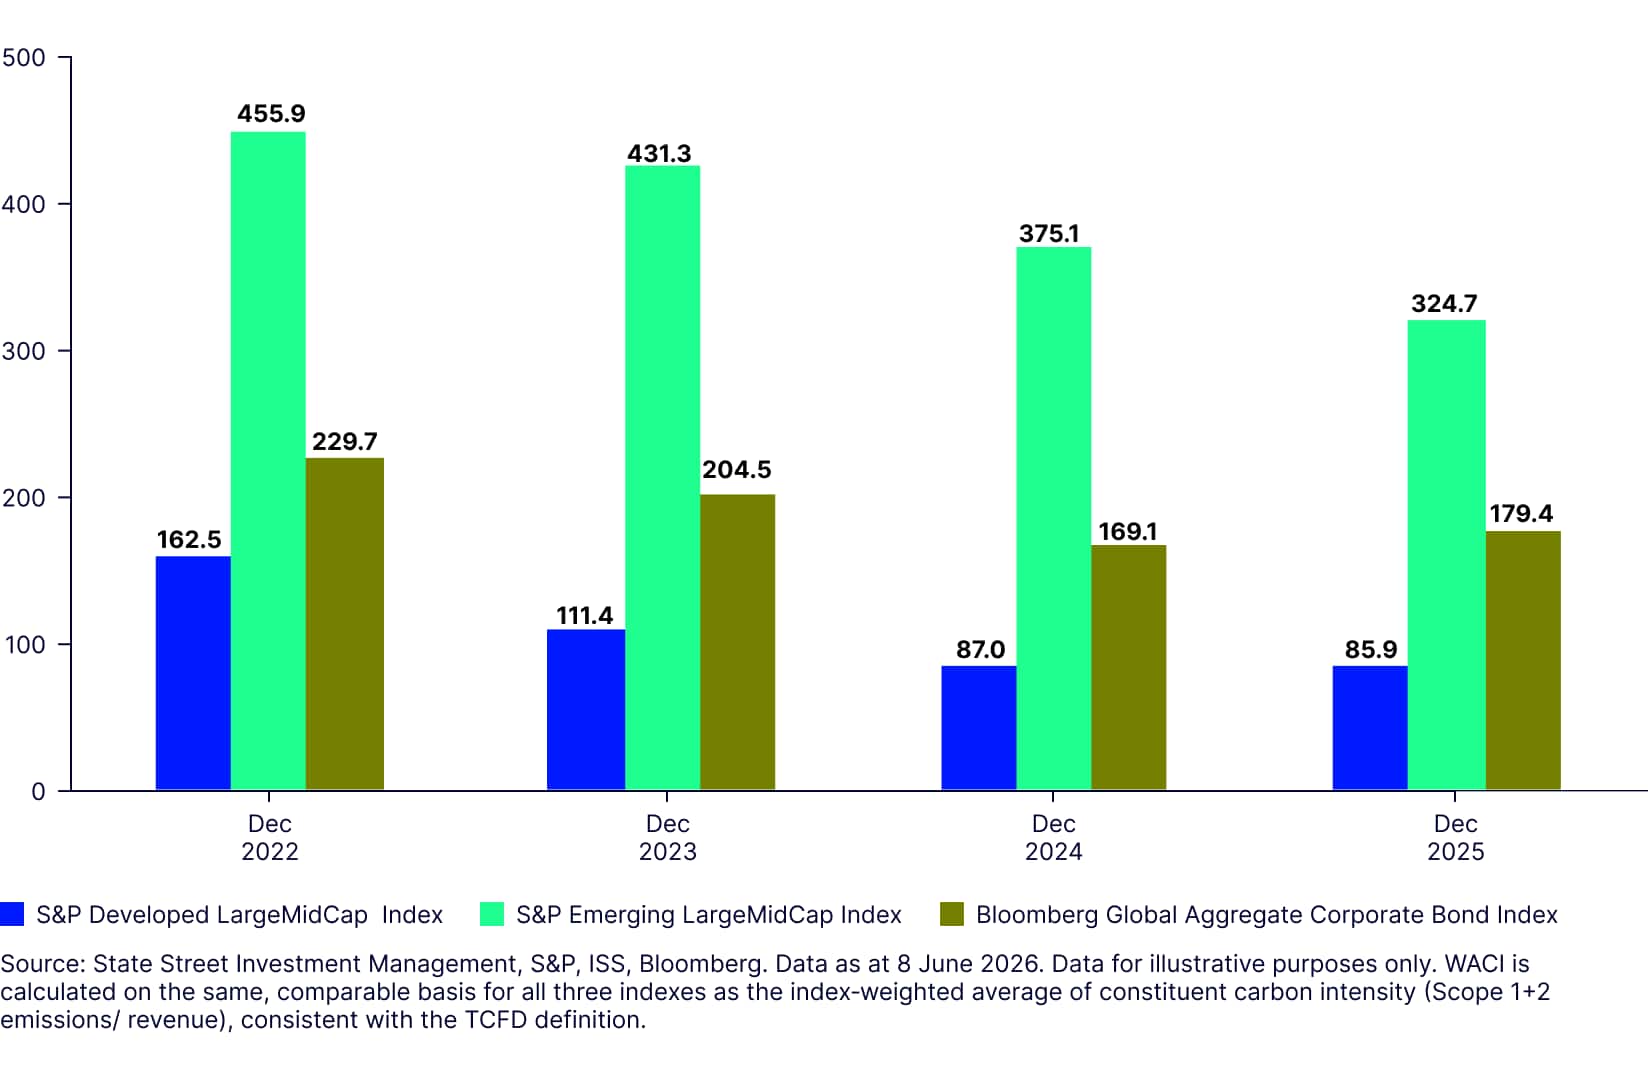
We note that the index WACI can be driven by various factors including changes in company emissions, normalization factors, market movements, and index changes. Additionally, it is interesting to observe that while total national emissions in DM and EM have declined slightly or increased in the latest available three-year period, the WACI of the regional indexes considered here have reduced significantly. This divergence can seem puzzling to many, and reinforces the need for having a framework which can break down WACI changes into various potential drivers, given institutional investor focus and allocation to such indexes.
Overview of the Carbon Attribution Framework
As noted above, the industry has developed some approaches to analyzing the drivers of changes in portfolio emissions metrics. These approaches—ranging from partial equilibrium methods to multi layer attribution structures—are often designed to be flexible to accommodate differences in various data sources and carbon metrics (absolute or intensity based). They provide a general structure for distinguishing the driving factors while highlighting the importance of data quality and coverage boundaries.9
To further understand the drivers of the change in index WACI, we utilize the carbon attribution framework described by Nagy et al.10 with a slight modification to consider outlier treatment,11 outlined in Figure 3.
Figure 3: Carbon Attribution Framework (Full)
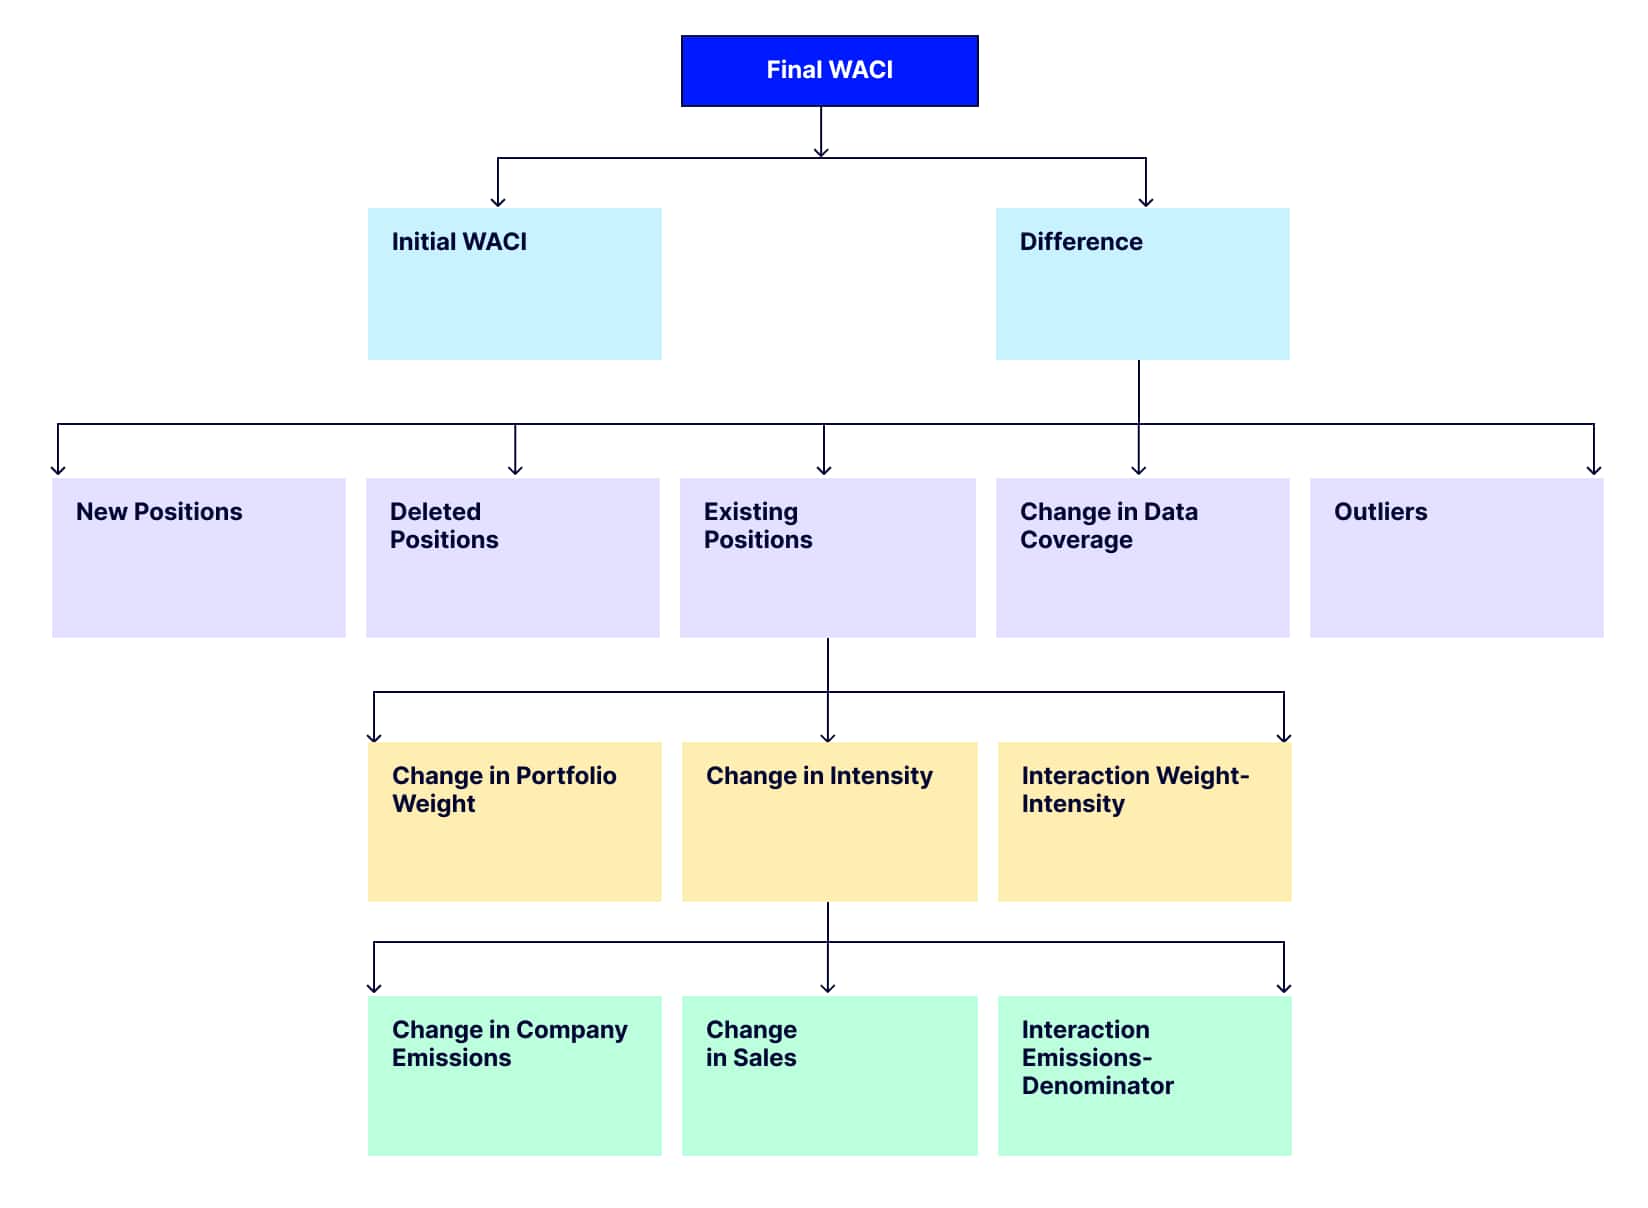
This framework is a hierarchical three-layered analysis that seeks to explain the factors contributing to changes in WACI.
It begins with the difference between the Final WACI (for example, as of 2025) and the Initial WACI (for example, as of 2022). This difference is first broken down in Layer 1, which identifies the types of portfolio positions influencing the change—namely, New Positions, Deleted Positions, Existing Positions, Change in Data Coverage, and Outliers.
Layer 2 explores what drives the change in each security’s contribution to WACI, distinguishing between changes in portfolio weight, emissions intensity, and the interaction between the two (i.e., the effect of both weight and intensity changing simultaneously).
Layer 3 goes further to analyze what causes changes in emissions intensity itself, attributing it to either changes in company emissions (numerator), the change in sales (denominator) used in the intensity calculation and the interaction between the two (i.e., the effect of both emissions and sales changing simultaneously).
There are also parallels between this framework (particularly at Layers 2 and 3) and the Brinson attribution framework often used to dissect sectoral allocation, selection and interaction effects. There can be several advantages of using this framework:
- It can help investors understand and attribute the drivers of WACI between changes in real-world emissions, portfolio changes or denominator effects.
- It can be flexibly applied to different portfolios, asset classes and time periods.
- It can be utilized for different types of emissions statistics (absolute or intensity) and normalization factors (sales, EVIC or market cap).
- It can also be used to delve deeper by applying it to different classification schemes within portfolios (e.g., sectors or regions).
At the same time, there may be several drawbacks that investors should consider when using this approach:
- The accuracy of the attribution depends heavily on the availability and reliability of emissions data, which can vary significantly across regions and/or sectors.
- The analytical framework is complex and may necessitate expert interpretation.
- The second and third layers focus on securities that remain in the portfolio over the period analyzed. This may reduce applicability for portfolios with higher turnover.
- The interaction terms in the second and third layers can be challenging to interpret. - Double counting effects between Scope 1 and Scope 2 emissions are not accounted for.12
Several of the limitations identified arise from the inherent complexity of emissions data and reporting frameworks, including issues such as data quality and the potential for double counting. While these considerations provide essential context, they are likely to influence any analysis of portfolio emissions. Therefore, in our view, this approach remains one of the more robust approaches currently available.
Furthermore, this article introduces sector-level breakdown enhancements designed to provide a more granular view of the data and to clarify the underlying interaction drivers.
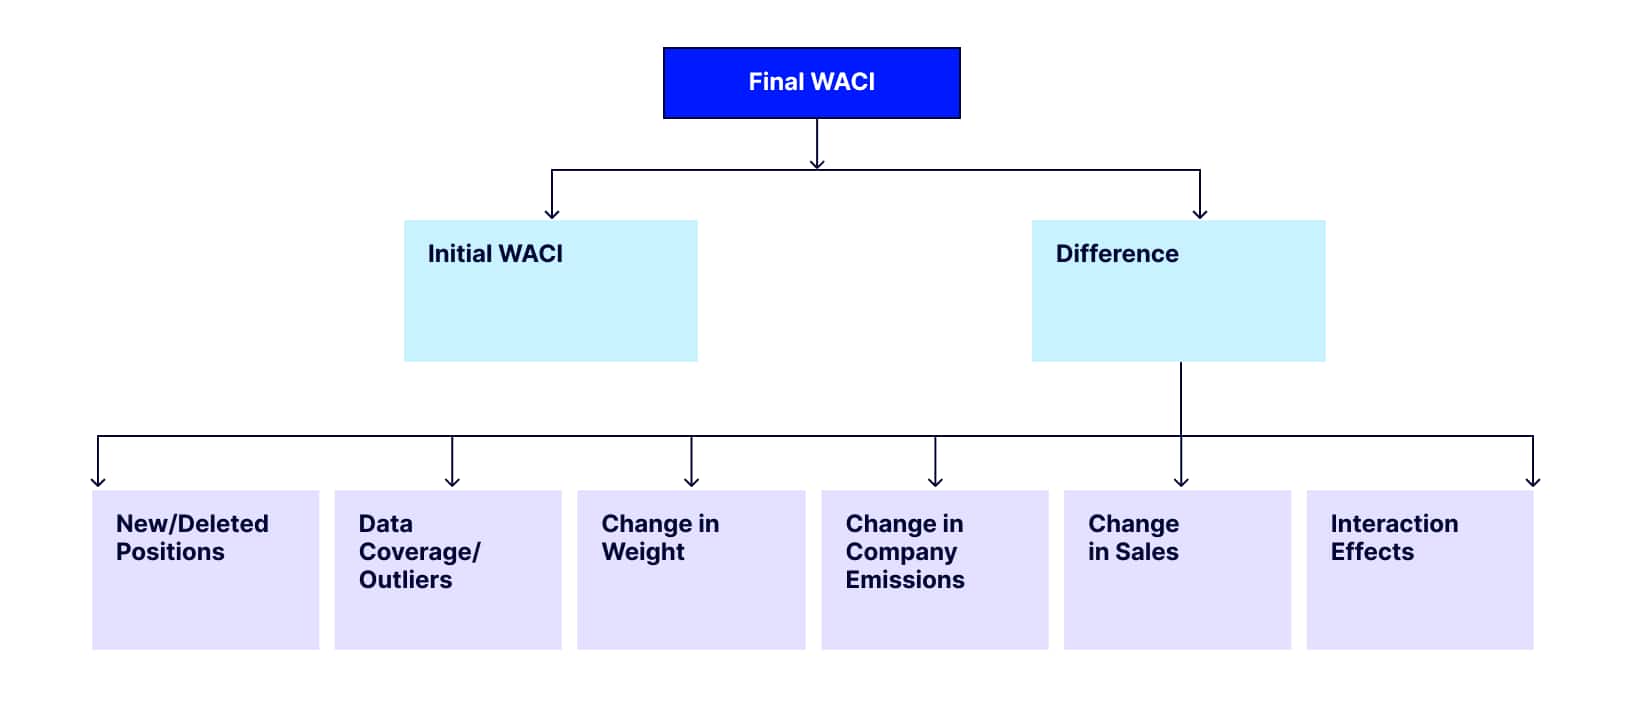
For the purposes of clear visualization, we use a simplified version of this framework by combining some terms and bringing all the various terms into a single layer (Figure 4). In Layer 1, we merge “New Positions” and “Deleted Positions” into a single category—“New/Deleted Positions”—and group “Change in Data Coverage” and “Outliers” under “Data Coverage / Outliers.” We replace the “Existing Positions” term with its underlying terms from Layers 2 and 3. In essence, we divide this term into “Change in weight,” “Change in company emissions,” and “Change in sales,” and introduce a unified “Interaction Effects” category to encapsulate the previously separate interaction terms (one each in Layers 2 and 3). This reorganization helps enhance clarity and analytical efficiency by focusing attention on what we view to be the most influential factors driving WACI variation.
Figure 4: Carbon Attribution Framework (Simplified)
We now apply this simplified framework to the S&P Developed LargeMidCap Index, the S&P Emerging LargeMidCap Index and the Bloomberg Global Aggregate Corporate Bond Index. We also extend this framework to various Global Industry Classification Standard (GICS) sectors in the S&P Developed LargeMidCap Index.
Figure 5: WACI Drivers in S&P Developed LargeMidCap Index
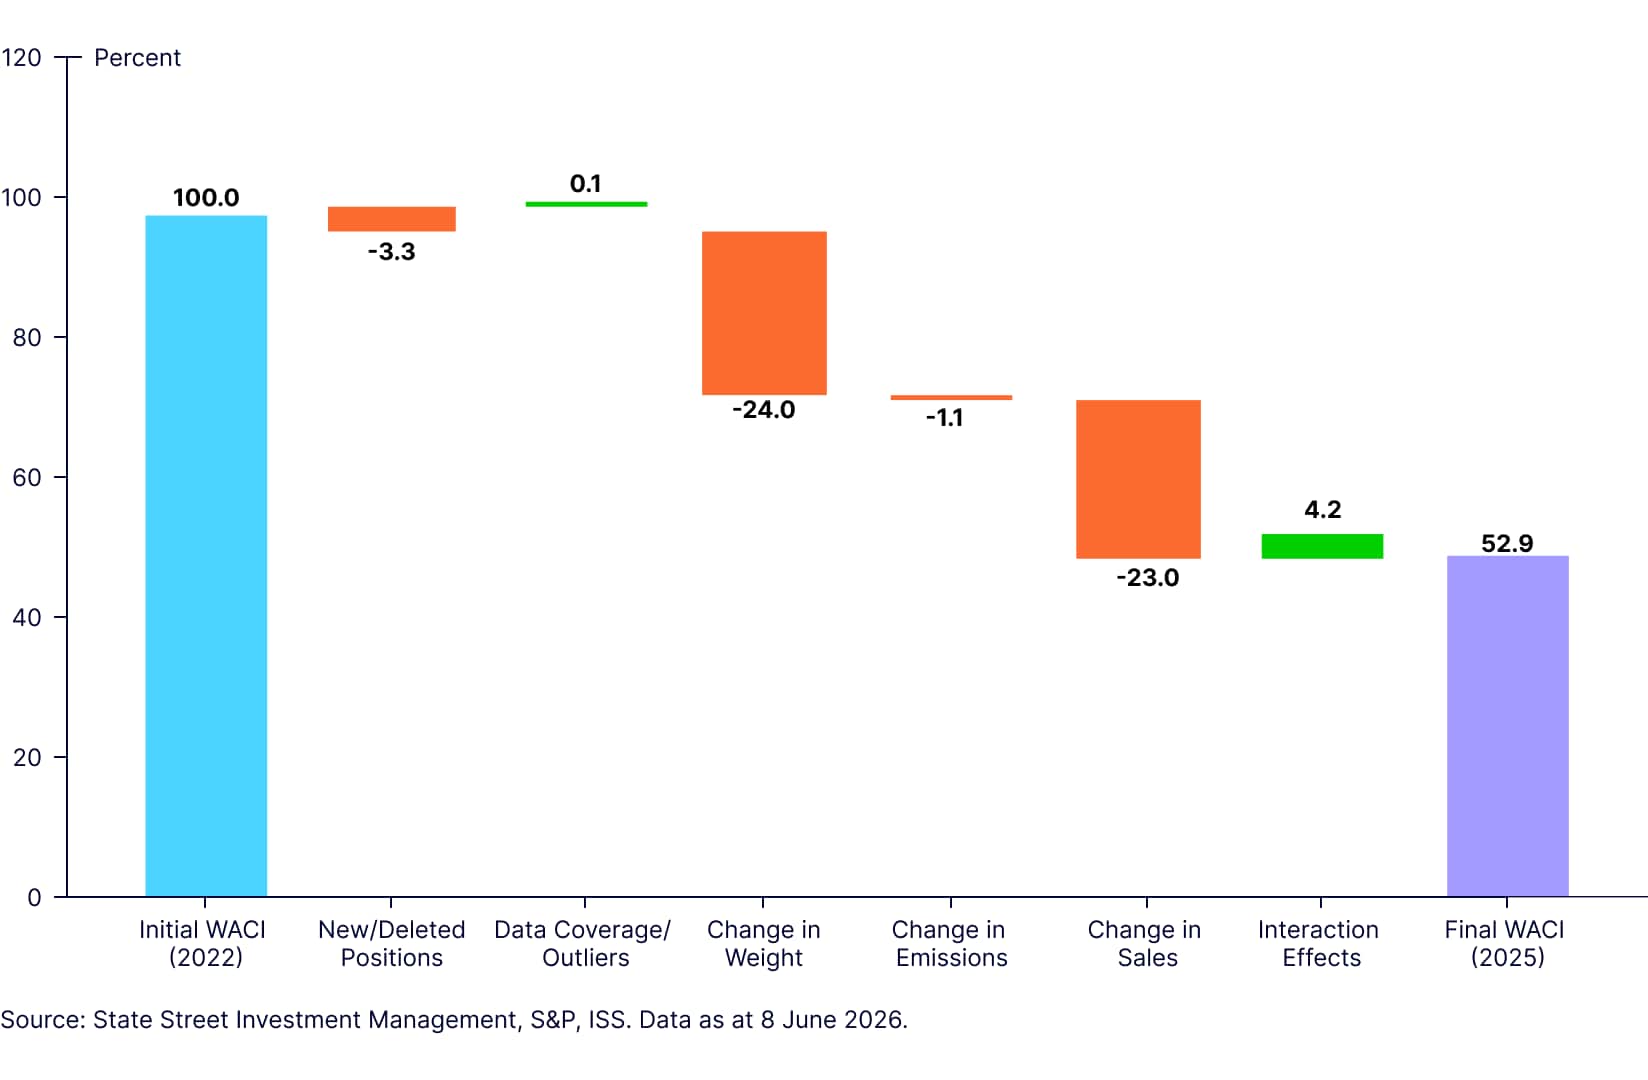
The WACI of the S&P Developed LargeMidCap Index declined by 47.1% between December 2022 and December 2025. Measuring each driver against the 2022 WACI (set at 100%), higher sales reduced the WACI by 23 percentage points, lower portfolio weights by 24 points (i.e., reduced weights in holdings that had a higher WACI than the initial portfolio), new or deleted positions by 3.3 points, and lower carbon emissions by 1.1 points. These reductions were partly offset by interaction effects, which added 4.2 points. Other drivers had a minimal effect.
Figure 6: WACI Drivers in S&P Emerging LargeMidCap Index
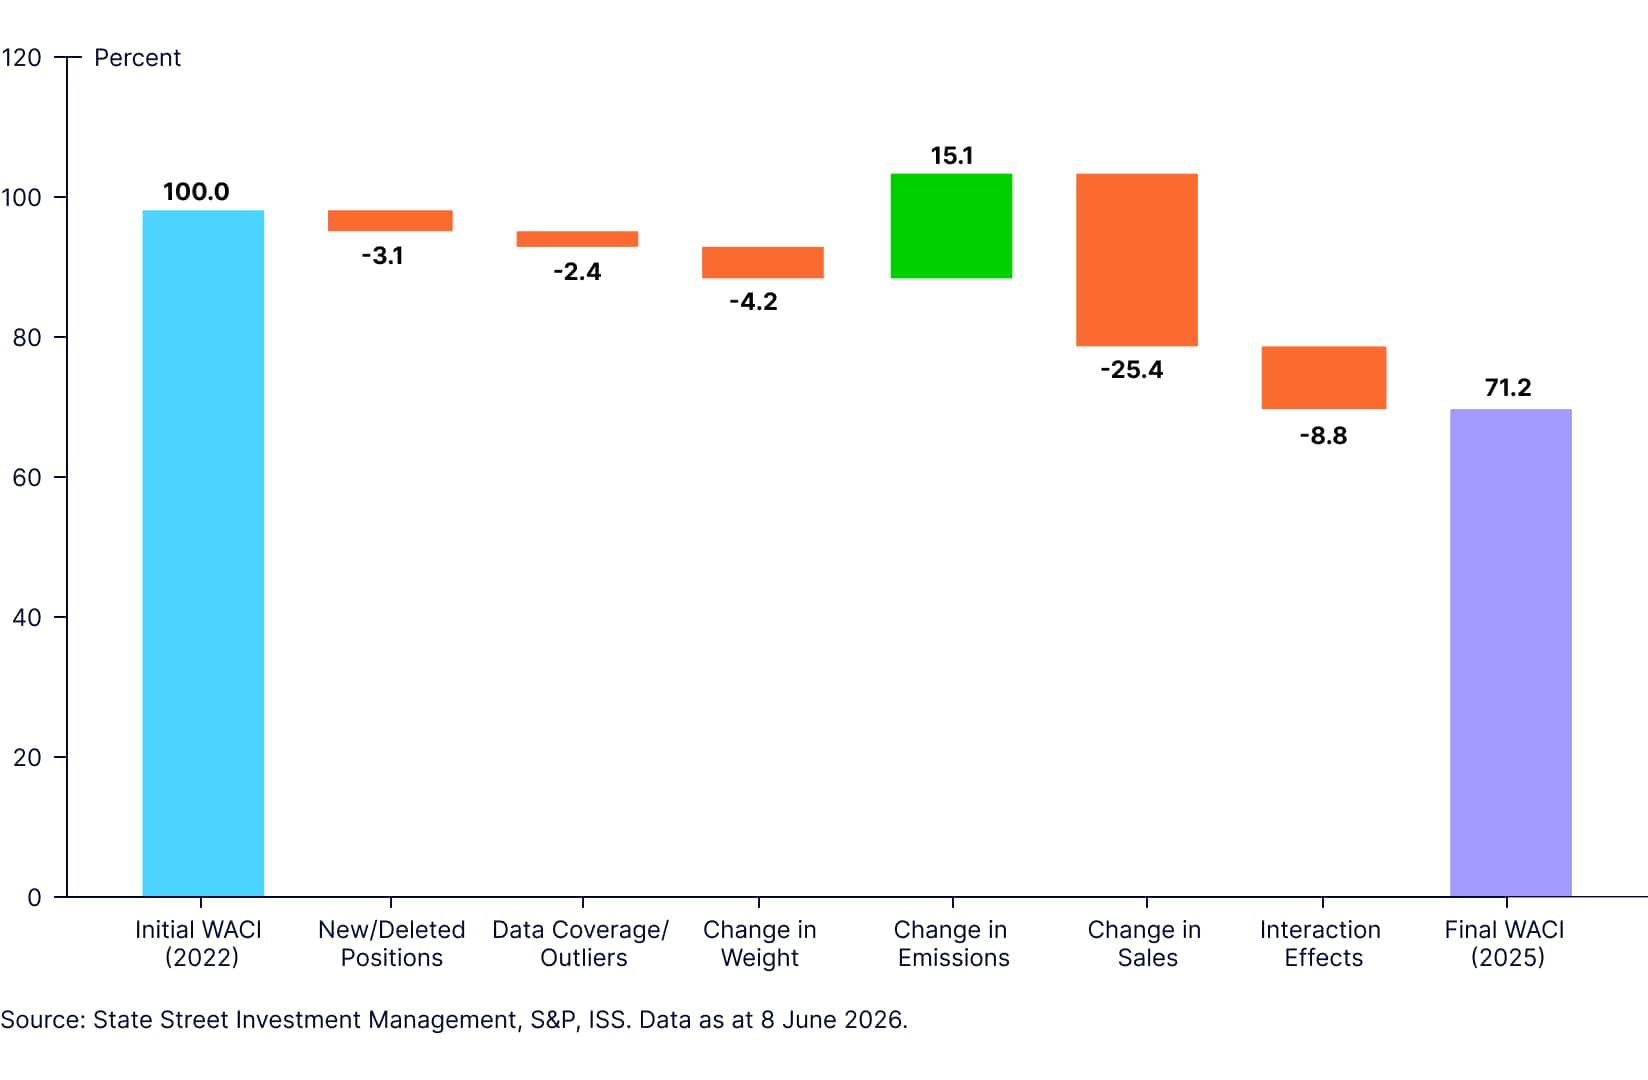
The WACI of the S&P Emerging LargeMidCap Index declined by 28.8% between December 2022 and December 2025. Measuring each driver against the 2022 WACI (set at 100%), higher sales reduced the WACI by 25.4 percentage points, interaction effects by 8.8 points, lower index weights by 4.2 points, new or deleted positions by 3.1 points, and changes in data coverage or outlier treatment by 2.4 points. These reductions were partly offset by higher carbon emissions, which added 15.1 points.
Figure 7: WACI Drivers in Bloomberg Global Aggregate Corporate Bond Index¹³
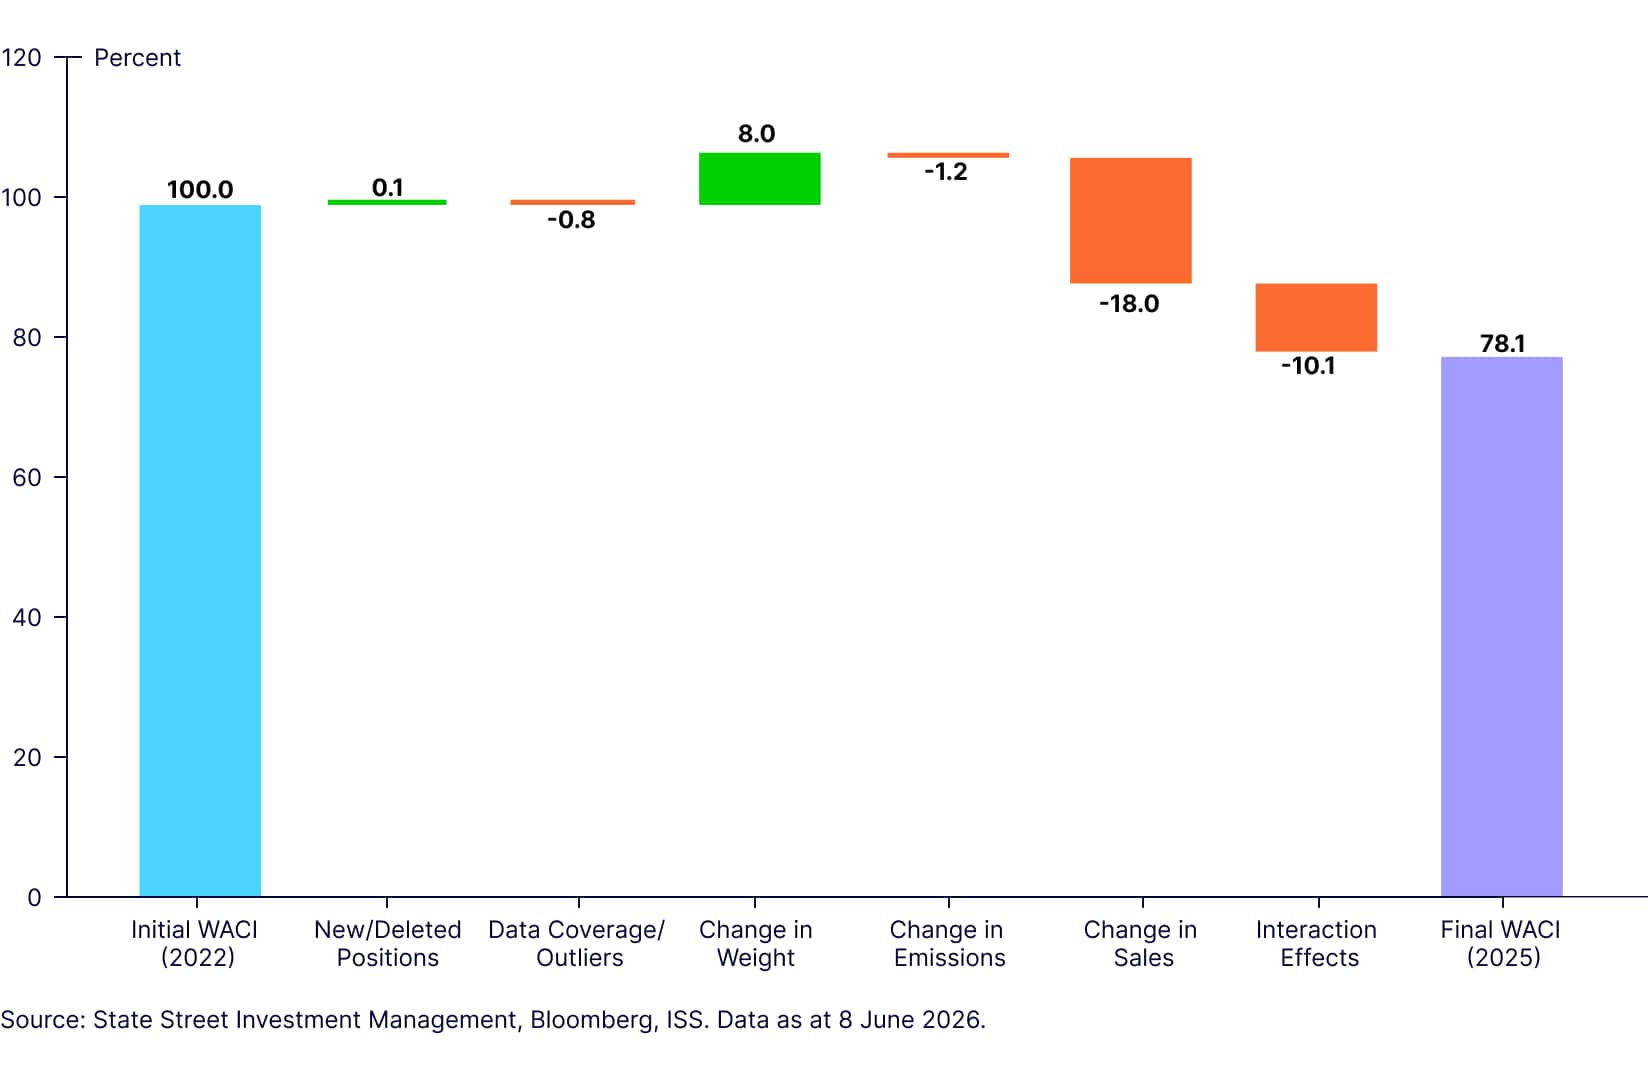
As noted above, this framework can also be applied to the fixed income asset class. In Figure 7, we apply it to the Bloomberg Global Aggregate Corporate Bond Index.
The WACI of the Bloomberg Global Aggregate Corporate Bond Index declined by 21.9% between December 2022 and December 2025. Measuring each driver against the 2022 WACI (set at 100%), higher sales reduced the WACI by 18 percentage points, interaction effects by 10.1 points, and lower carbon emissions by 1.2 points. These reductions were partly offset by higher index weights, which added 8 points. Other drivers had a minimal effect.
WACI Drivers in S&P Developed LargeMidCap Index: A Sectoral Analysis
We further breakdown the change in S&P Developed LargeMidCap Index’s WACI to various GICS sectors, and apply the attribution framework per sector to provide additional insights. The breakdown method can also be applied on country or any other type of categorical classifications as long as there is sufficient data.
The table below shows sectoral contributions to the Index WACI at December 2022 and December 2025, as well as the sources of deviation at the sectoral level.
| Sector | Weight in Index (2025) | Weight in Index (2022) | Contribution to Index WACI (2025) | Contribution to Index WACI (2022) | Absolute Difference | % Change in Sectoral Contribution |
| Energy | 3.20% | 5.50% | 14.2 | 39.7 | -25.5 | -64.20% |
| Materials | 3.10% | 4.40% | 18 | 31.5 | -13.5 | -42.80% |
| Industrials | 11.10% | 11.30% | 8.1 | 14.7 | -6.5 | -44.60% |
| Consumer Discretionary | 10.00% | 9.60% | 2.8 | 3.7 | -0.9 | -24.60% |
| Consumer Staples | 5.20% | 8.20% | 1.4 | 3.6 | -2.2 | -60.70% |
| Health Care | 9.40% | 14.50% | 1.1 | 2.5 | -1.4 | -57.30% |
| Financials | 17.10% | 16.20% | 2.5 | 3.8 | -1.4 | -36.10% |
| Information Technology | 27.90% | 18.30% | 4.5 | 3.8 | 0.7 | 18.70% |
| Communication Services | 8.80% | 6.20% | 0.8 | 0.9 | 0 | -4.40% |
| Utilities | 2.40% | 3.20% | 31.8 | 57 | -25.2 | -44.20% |
| Real Estate | 1.70% | 2.50% | 0.8 | 1.6 | -0.8 | -48.60% |
| Total | 100.00% | 100.00% | 86 | 162.6 | -76.6 |
Source: State Street Investment Management, S&P, ISS. Data as at 8 June 2026. Figures are rounded and may not add to totals.
At a high level, we can see that the Utilities, Energy and Materials sectors contribute the most to the index WACI, as well as to the change in index WACI from 2022 to 2025. We now break these contributions further using the simplified attribution framework as described above.
For sectoral analysis, separate terms are added to account for carbon intensity changes caused by total sector weights allocations as well as those securities that have seen a change in their sector classification at the first layer of attribution. For the waterfall charts in Figures 8,9, and 10, these two terms are absorbed into the “Change in Weight” term for simplicity.
WACI Drivers – Selected S&P Developed LargeMidCap Index Sectors
Figure 8: WACI Drivers in S&P Developed LargeMidCap Index: Energy Sector
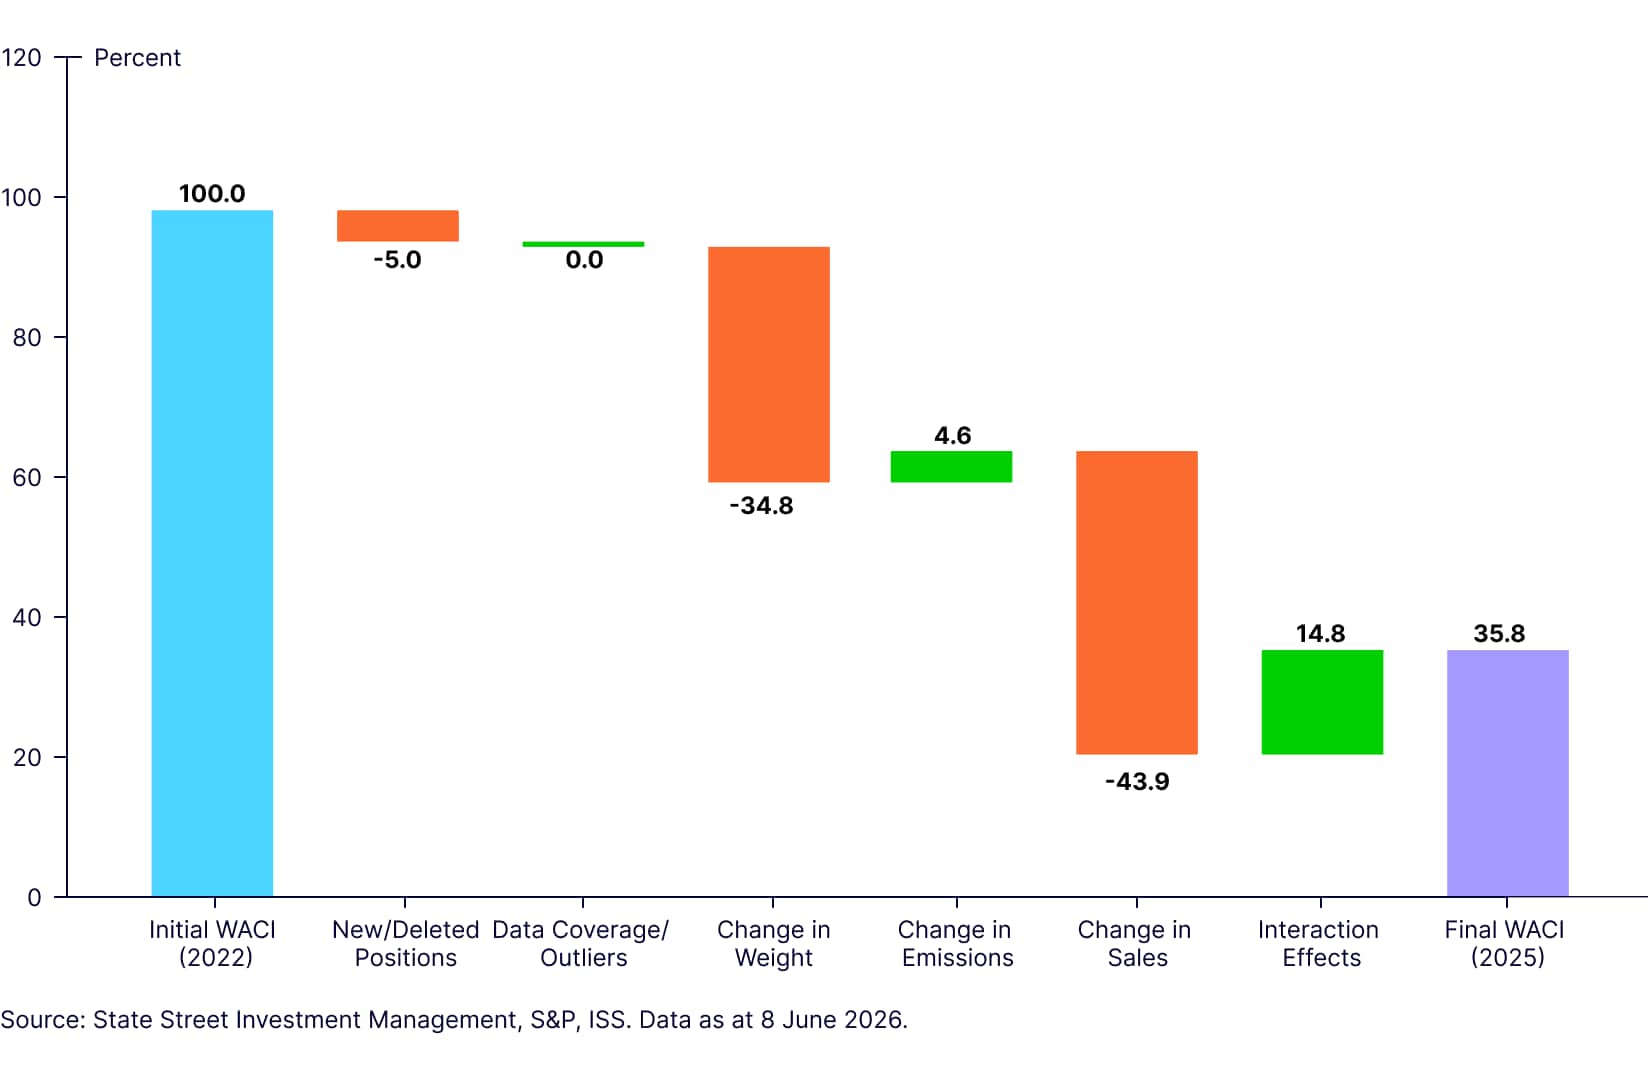
Figure 9: WACI Drivers in S&P Developed LargeMidCap Index: Utilities Sector
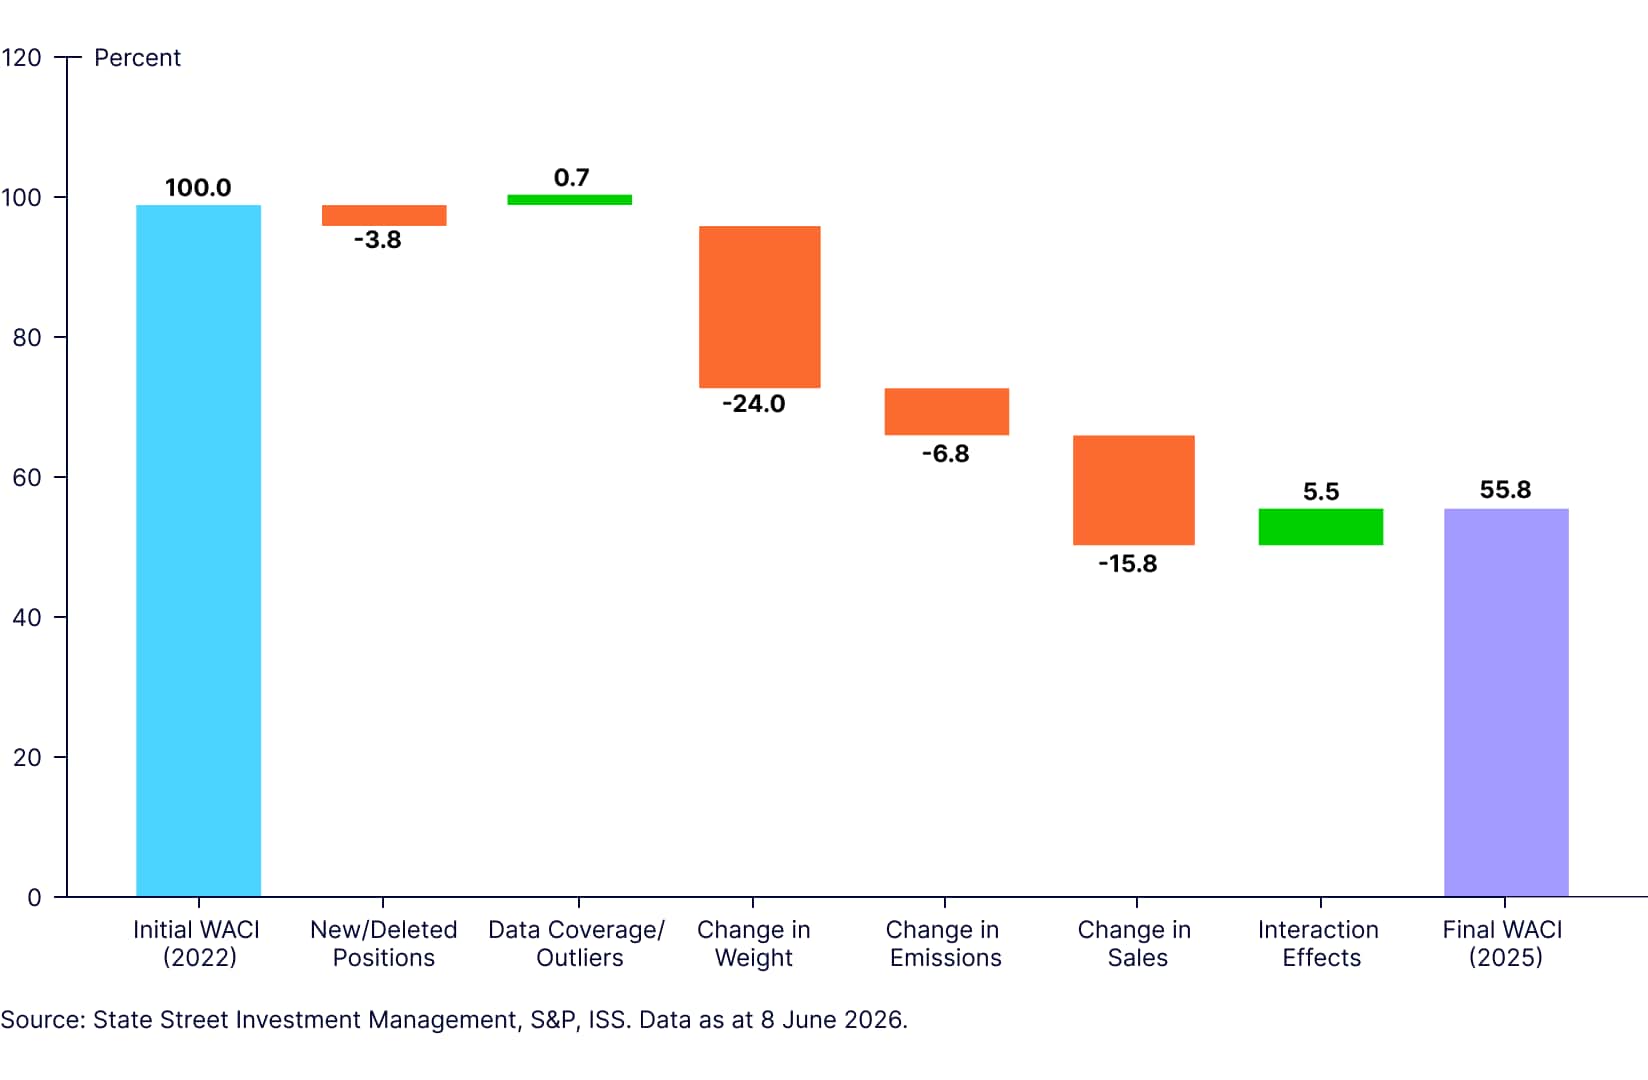
Figure 10: WACI Drivers in S&P Developed LargeMidCap Index: Materials Sector
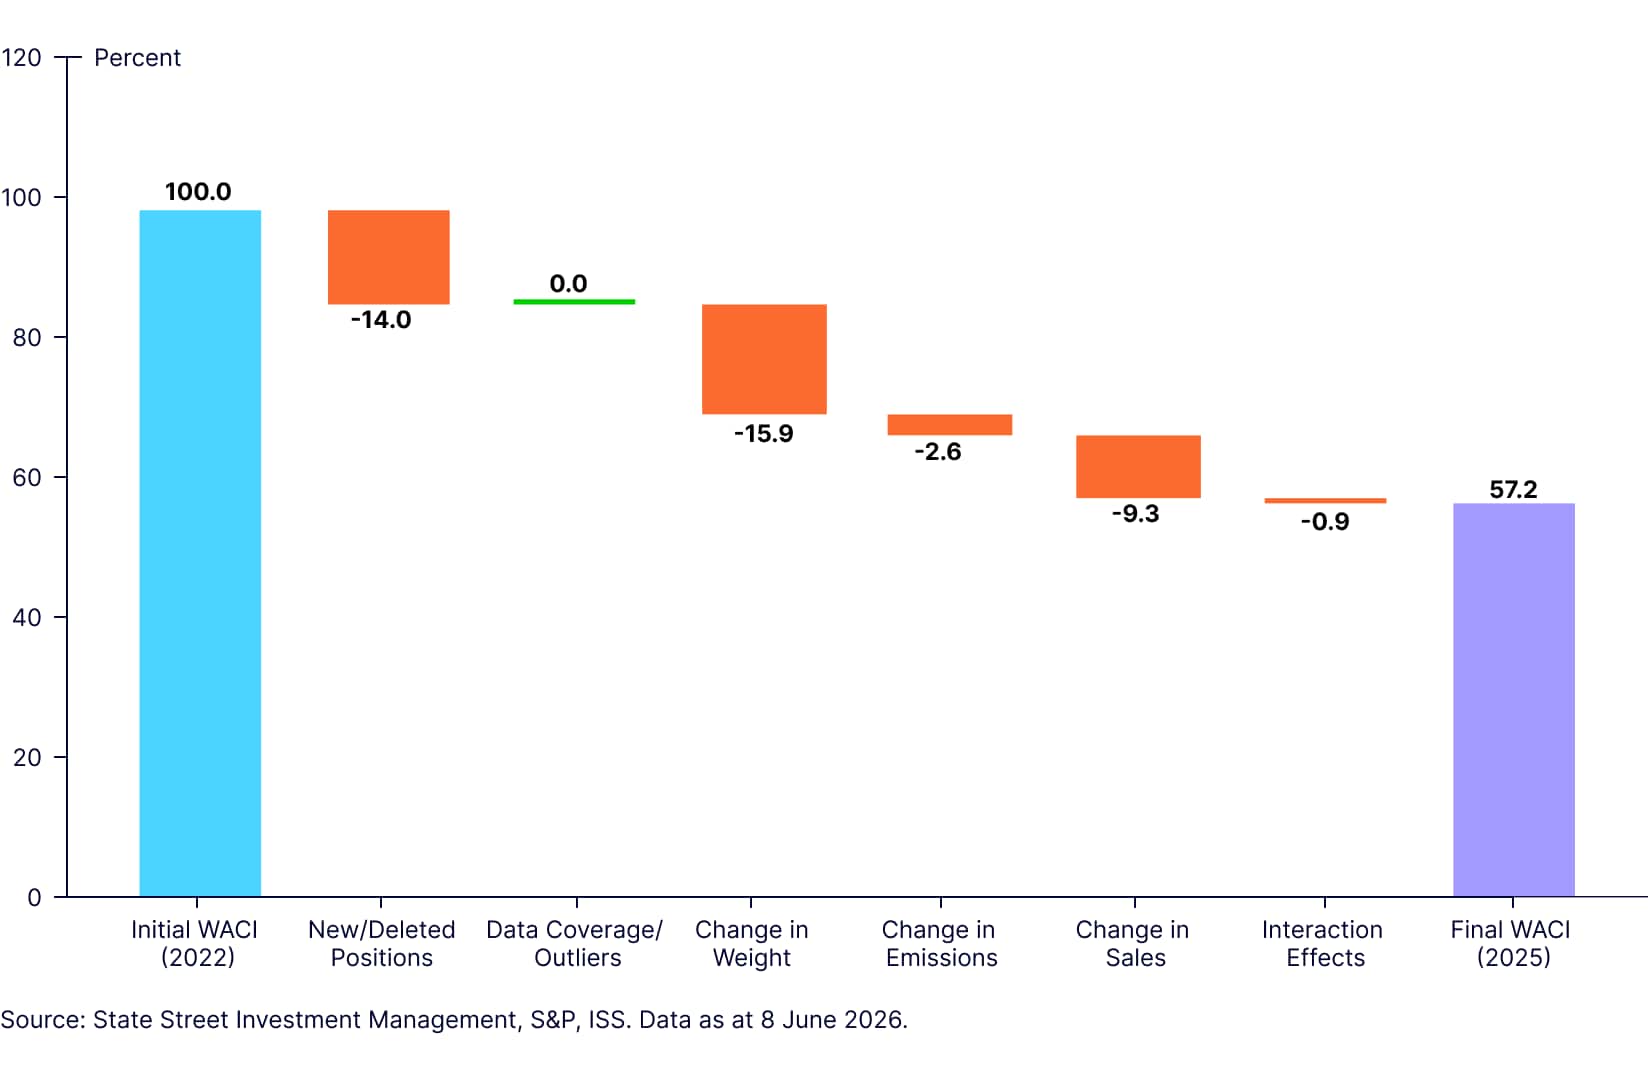
The Energy sector exhibits the highest WACI reductions in the last three years, followed by the Utilities sector and the Materials sector. Looking into the attribution factors, the interpretation of these sectoral charts is very similar to that of the index-level in the previous section. Some key observations:
- Relative to the index, New/Deleted Positions appear to be a more significant driver of WACI changes, particularly in Materials.
- Similarly, the Change in Weight also is a bigger driver since it considers the total sector weight allocations.
- For Utilities and Materials sectors, Change in Company Emissions has a downward effect on WACI contribution, while this is reversed for the Energy sectors. In other words, companies’ emissions in the Utilities/Materials sectors reduced in aggregate, while those in Energy increased in total.
- Across all sectors, the Change in Sales term (i.e., an increase in sales) has a notable downward effect on WACI contribution, particularly in Energy.
Conclusion
This analysis highlights the multifaceted nature of changes in Weighted Average Carbon Intensity (WACI) across major equity and fixed income indexes. While headline reductions in WACI may suggest that index constituents have decarbonized, our application of the carbon attribution framework suggests that these changes are often driven more by financial metrics (i.e., increase in sales) than by actual reductions in emissions. Sectoral analysis further dissects the drivers within some carbon-intensive sectors, and how they may differ to the overall index WACI. We note that this framework can be flexibly applied to different types of portfolios as long as data is available and can be a useful tool for investors seeking a more nuanced understanding of the underlying drivers of changes in portfolio emissions metrics.