Where are the inflation havens? State Street Market's fixed income and inflation insights
Asset managers’ main response to the outbreak of war in the Middle East was to trim their still significant equity allocations. Holdings fell by more than 150 basis points (bps) over the month, with most—around 100bps — moving straight into cash. There was a modest shift into fixed income and, as shown in Figure 1, some clear preferences over where investors sought safety.
Sovereign and corporate flows in March show some classic risk-off behaviour, but with a few nuances. The sharp drop in demand for local emerging-market sovereign bonds, alongside the surge into US Treasury Inflation Protected Securities (TIPS), looks like a standard response to an energy shock that has also driven US dollar appreciation (a notable move in its own right). Meanwhile, investor sentiment deteriorated sharply for both Japanese and UK sovereign bonds; both markets already facing questions around fiscal sustainability and both now potentially more exposed to stagflation risks.
What stands out, though, is how little moved elsewhere in March. Asset manager demand for US Treasuries remained weak. So, while the USD appears to have regained its safe-haven status, US duration has not. In contrast, inflows into Dutch and German bonds stayed close to a five-year high. Weak demand for French sovereign OATs offsets this a little, but the broader message still holds: demand for European duration, and for corporate bonds remains firmer, perhaps reflecting a view that the European Central Bank (ECB) is less likely to accommodate the coming inflation shock.
Figure 1: Asset manager fixed income flows Feb/Mar-26
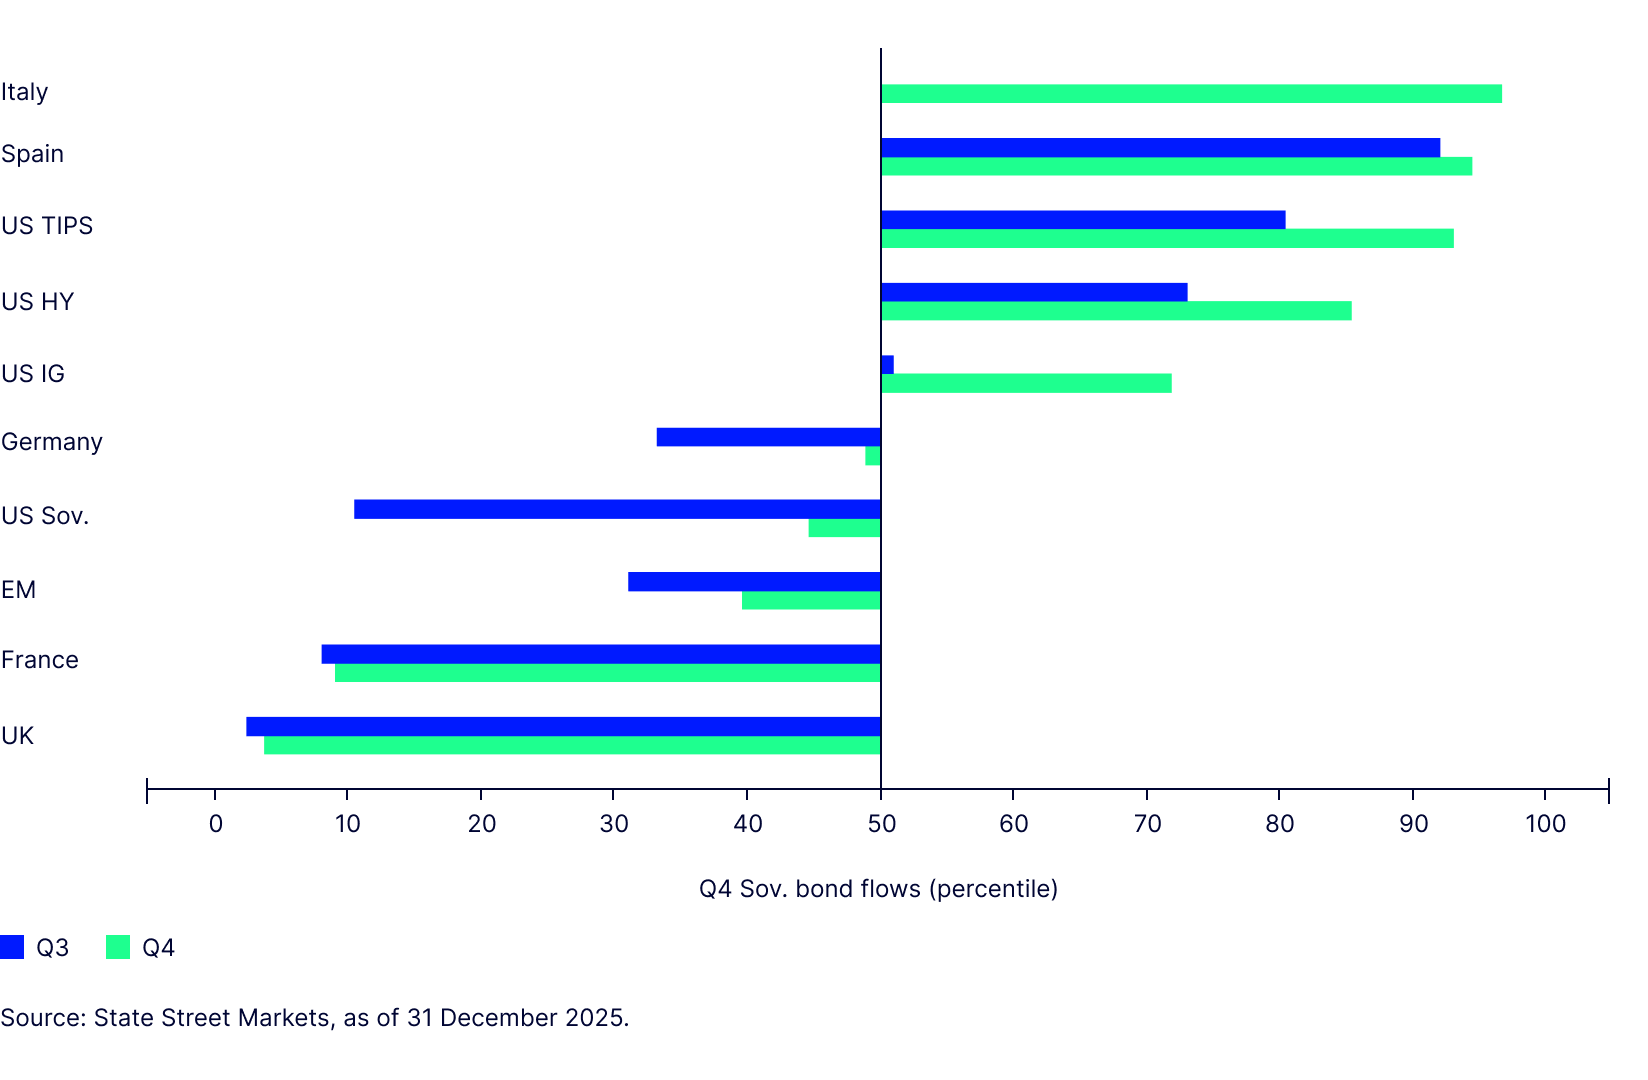
It is not all bad news for US fixed income. High yield corporate demand improved in March, suggesting that credit and recession risks are not top of mind. There are also tentative signs of optimism on inflation—the return of long-term demand for US TIPS across the curve hints that some investors still expect any inflation spike to prove transitory.
Inflation: not a 2022 redux
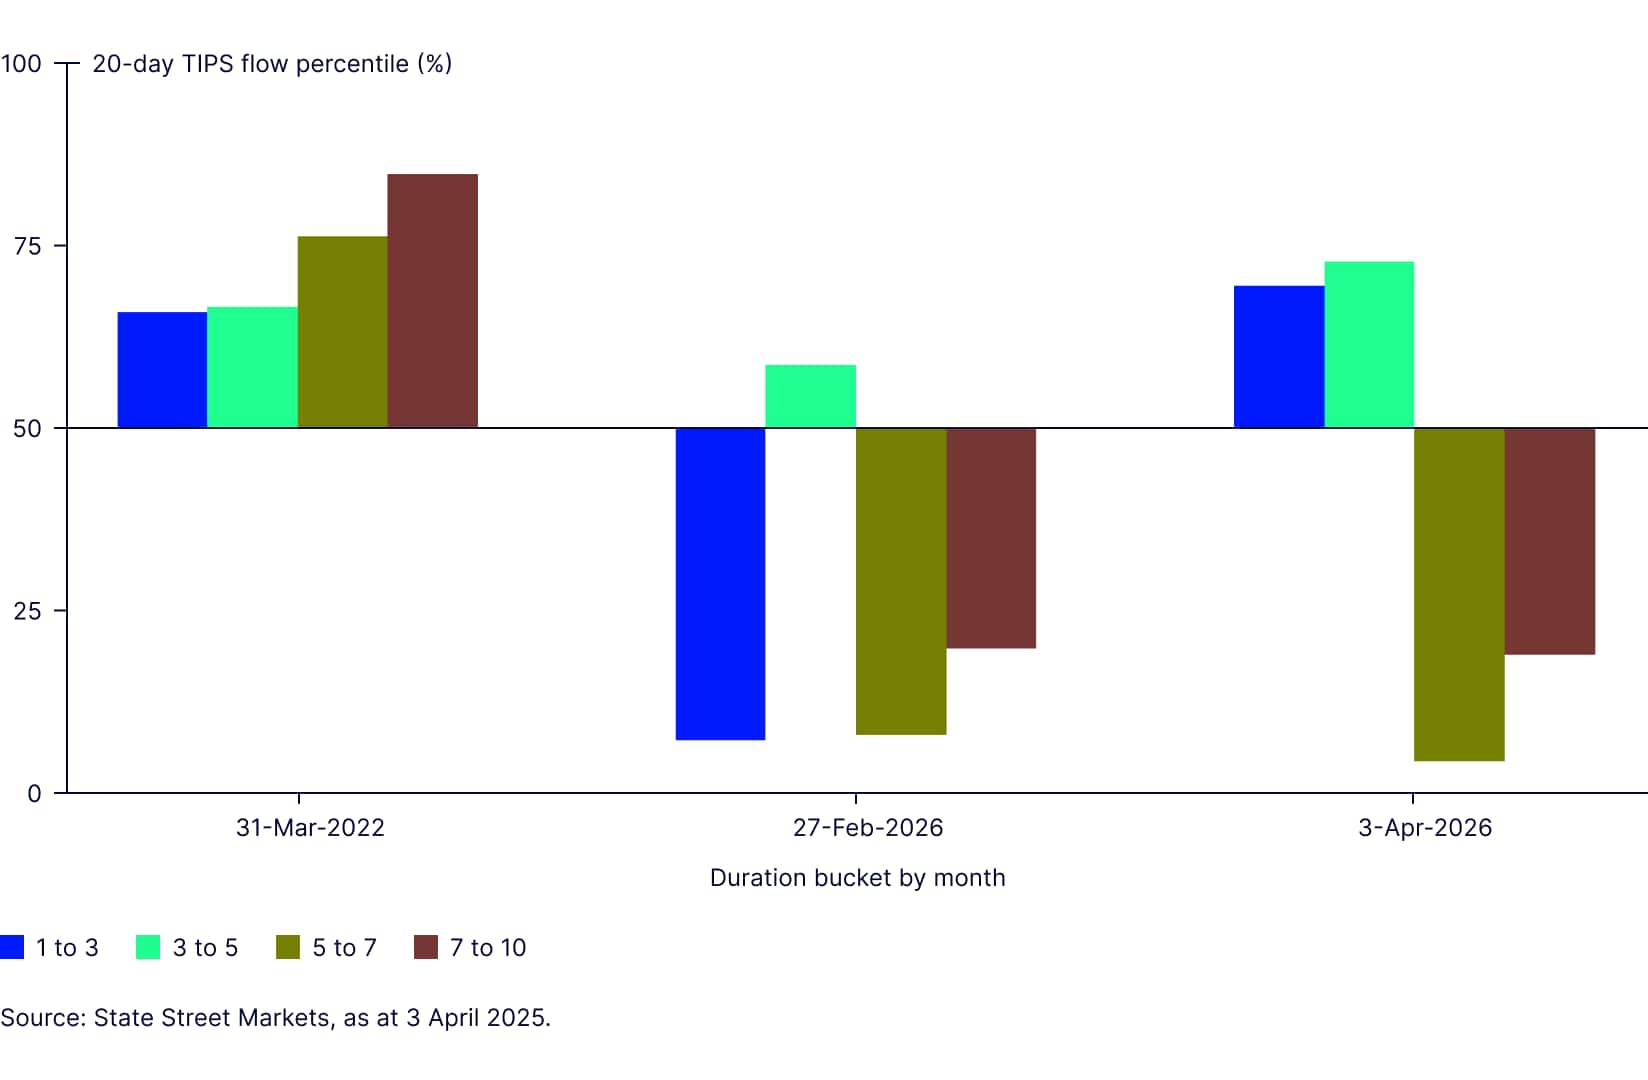
The pattern so far in 2026 is more concentrated when compared with the last major energy shock in March 2022, which saw steady demand for TIPS across maturities. This time round, appetite has picked up mainly in the 1–5 year segment of the curve, while appetite for inflation protection in the 5–10 year segment remained below average in the month to 3 April. It is, of course, still early, but we read this as a tentative sign that long-term inflation expectations are better anchored than they were in 2022.
Markets and investors appear to be betting that central banks have learnt their lesson.
Figure 2: Investor appetite for US inflation protection by duration (selected months)
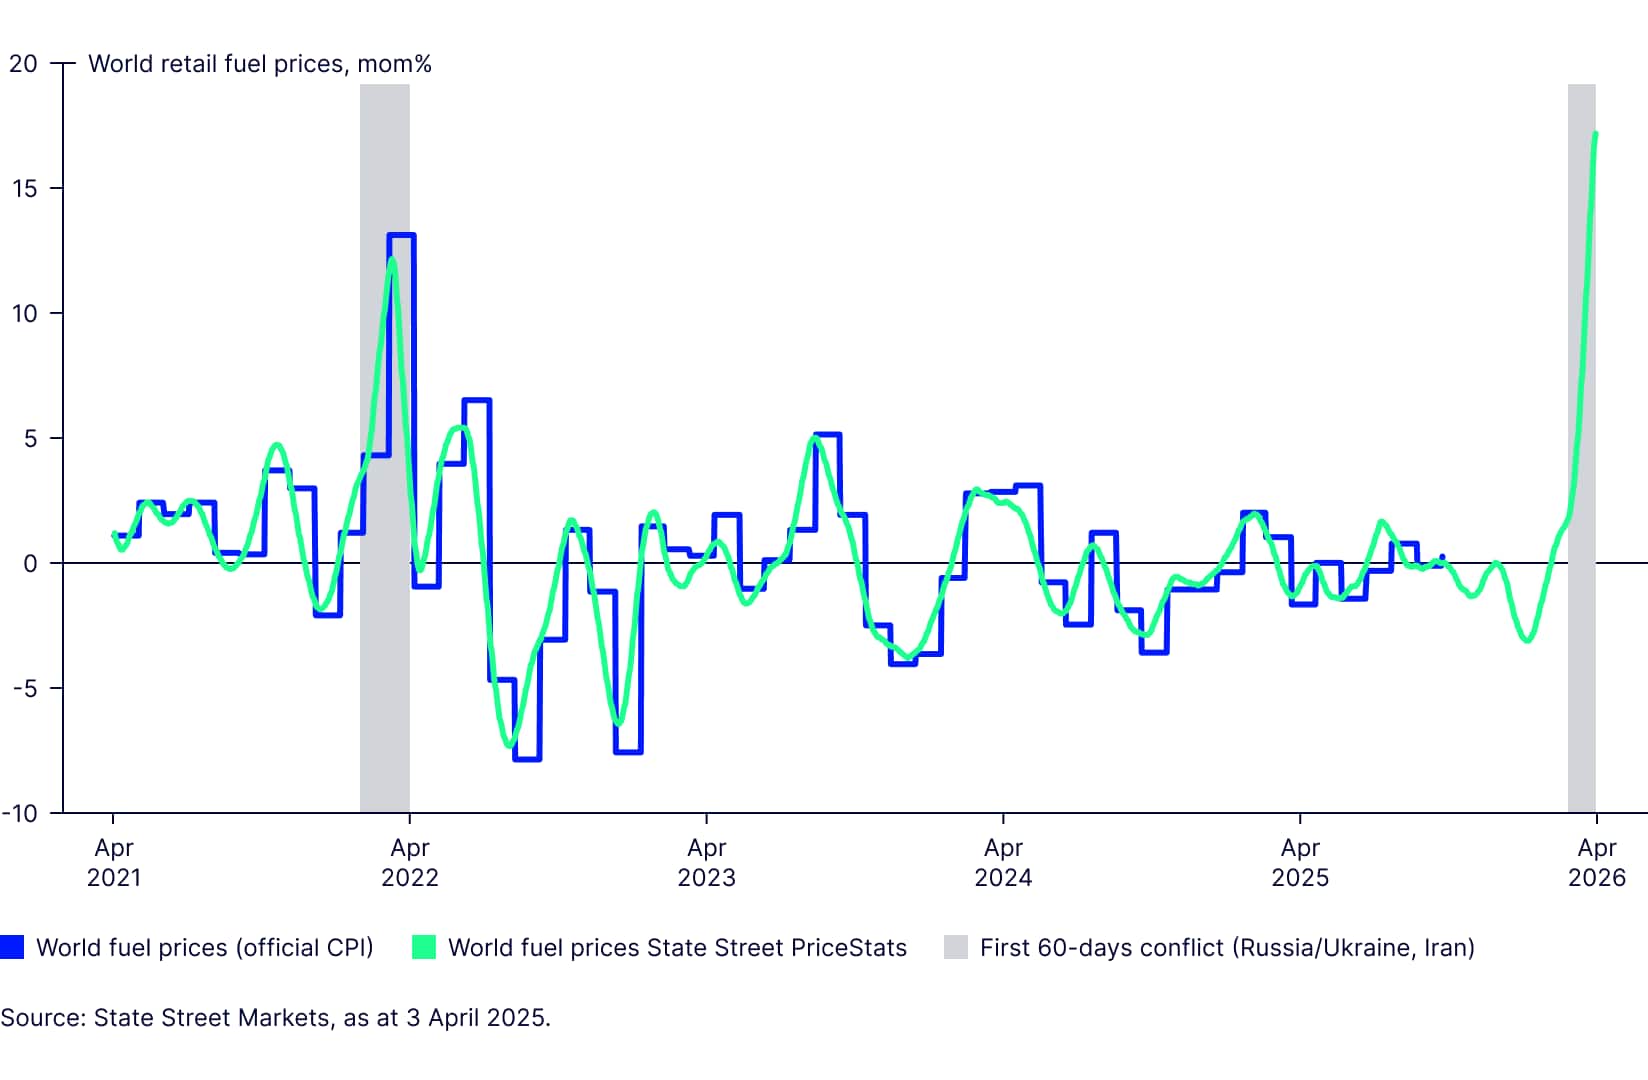
Whether this optimism is justified will depend on the path of policy and, more importantly, inflation. State Street PriceStats suggests that the 2026 re-run of the energy shock is already having a larger impact on retail fuel prices globally. Across most countries we track, the pass-through from higher crude prices into pump prices has been both larger and faster than in March 2022, implying headline inflation could rise by as much as a percentage point. What differs from 2022 so far, however, is that spillovers beyond energy remain modest. Aside from strength in apparel, our US series indicates core goods inflation, such as household equipment and furnishings, remains controlled for now.
Based on the first six weeks of data since the end of February, the message is that this is a larger headline inflation shock than tariffs. but that demand and labour market conditions, which are quite different from 2022, are so far limiting spillovers into other sectors. Overall, the data are consistent with investors' views that the rise in inflation will be temporary.
Figure 3: World fuel prices and CPI
Read our Q2 Fixed Income Outlook, examining fixed income strategies for the changed environment.