Investment outlook
The Fed has resumed its rate cutting cycle, elevated inflation, tight credit spreads, and high valuations are still a cause for concern. To try and mitigate some of the risks, investors can consider:
- Short to intermediate duration to prepare for uncertainty
- High quality to potentially gain resiliency
- EM debt and convertibles to diversify
Sticking to the short to intermediate end
The Federal Reserve has resumed its rate-cutting cycle. Avoiding an overweight position in duration remains prudent given the curve’s tendency to steepen amid fiscal risks. In the UK elevated inflation risks hamper easing, so the front end of the curve is favourable for yield.
The Federal Reserve (Fed) has finally resumed its rate cutting cycle. Weak labour market statistics outweighed concerns over higher-than-desirable inflation, becoming the catalyst for reductions. The market has now priced in a series of cuts taking rates down to around 3% by the end of 2026. This broadly aligns with State Street Investment Management’s view, although the market has tended to get ahead of itself when discounting cuts.
Figure 1: Markets tend to overpredict rate cuts
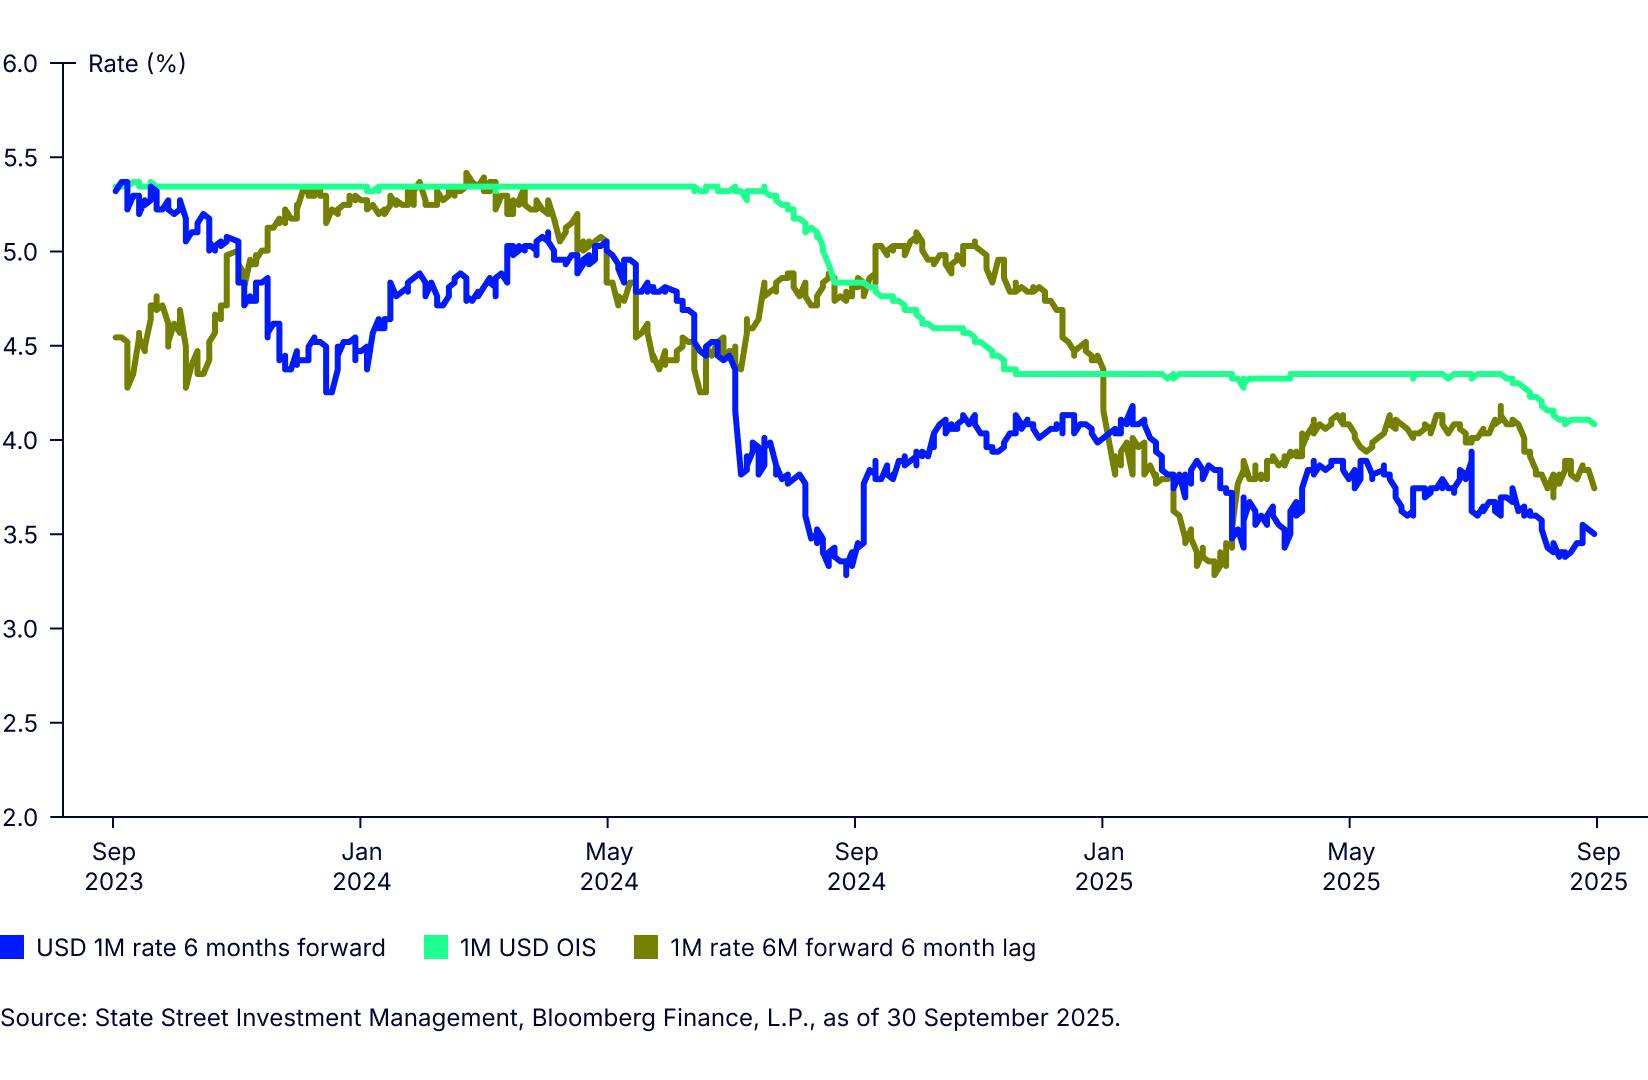
Figure 1 displays the spot 1-month Overnight Index Swap (OIS) rate, the six-month forward of the 1-month rate and the same rate with a six-month lag. Notably, the 1-month-rate projected six months forward has consistently been below the 1-month rate, indicating that since September 2023, the market has regularly expected rate declines over the subsequent six months. Comparing the actual 1-month rate to what had been ‘predicted’ by the six-month forward rate reveals that the market has tended to overestimate the imminence of rate cuts. The forward rate was broadly accurate in Q1 2024, predicting steady rates. However, there was a period of overestimation in late 2024, a sign of uncertainty over how much rates could be cut. Since the 1-month rate troughed in late 2024, expectations have persisted that the next move in rates would be a substantial easing.
The current level of the 1-month-rate six-months forward appears close to its more stretched levels, which makes it vulnerable to pullbacks. Building consensus of a recession could push rates lower. This is not our central scenario—State Street Investment Management expects a rebound in growth in 2026. This asymmetrical bias to rates supports caution over taking too much duration risk.
Figure 2: Treasury returns proved higher at front end during first wave of Fed cuts
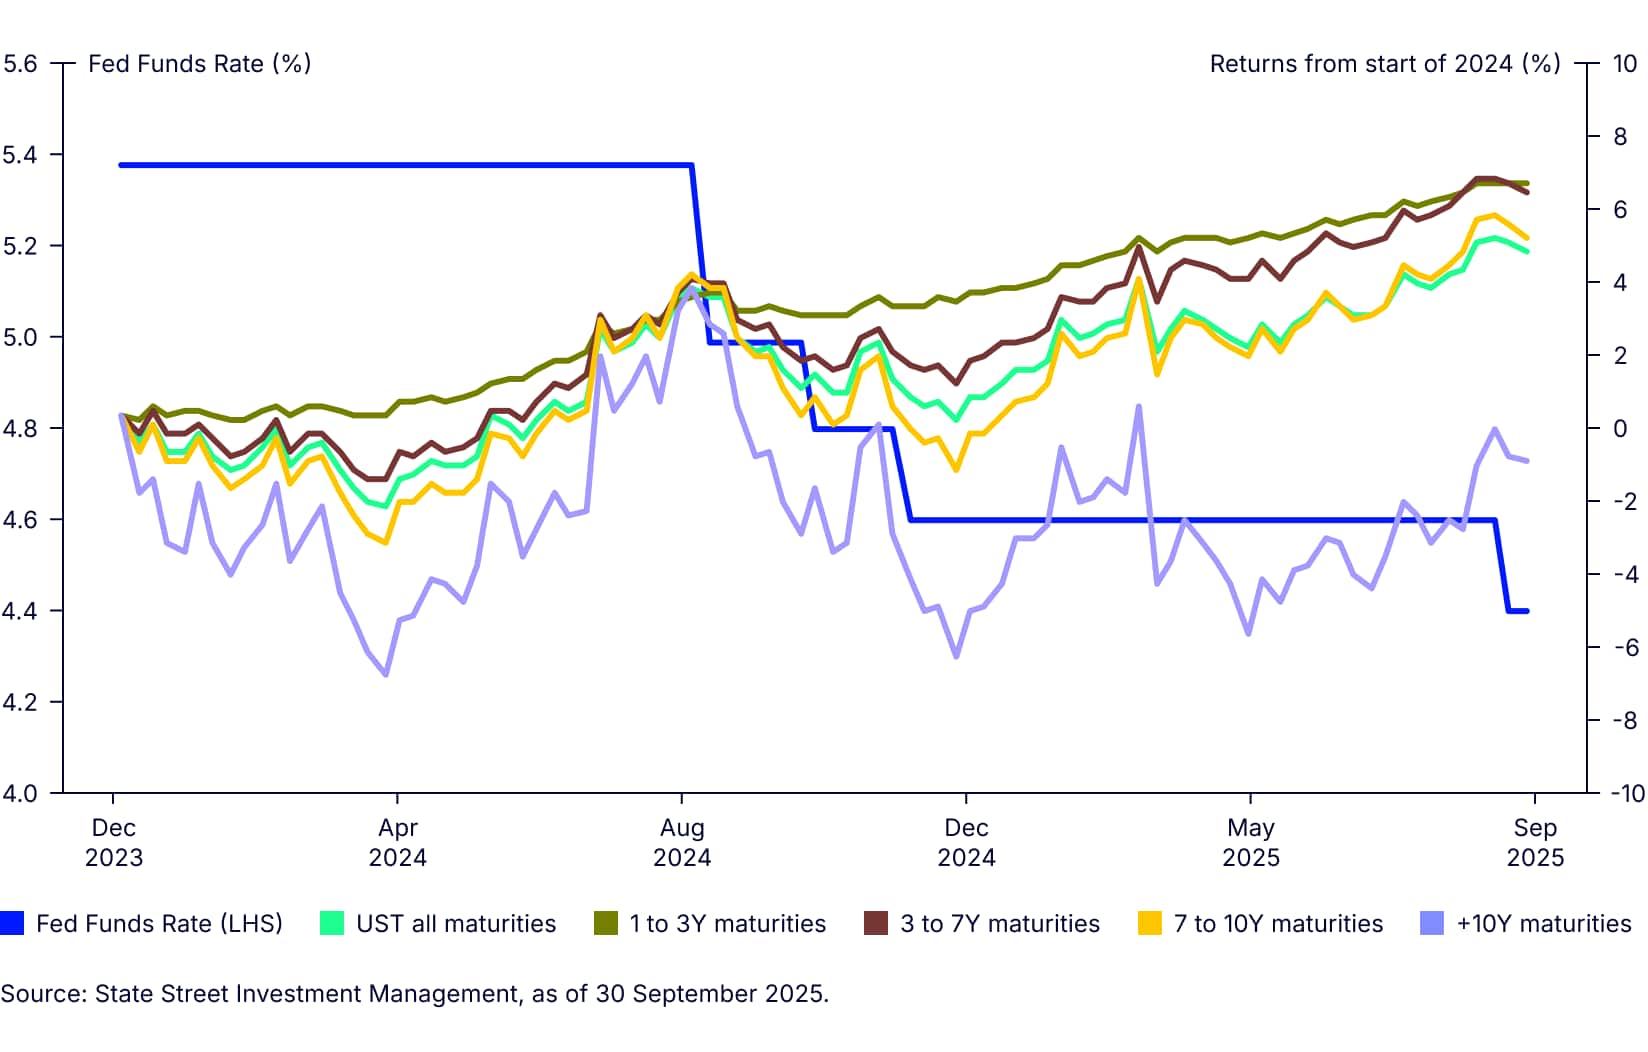
From a curve positioning perspective, Figure 2 illustrates the total returns of various maturity indices around phase 1 of the Fed’s rate cut cycle. Longer duration indices posted the greatest gains leading up to the first cut. After the cut, returns were more attractive for shorter-duration exposures. Returns in the shortest buckets remained elevated due to their alignment with the Fed Funds Rate, which declined to a still appealing 4.25-4.5%. As this rate falls further, returns will also decrease. Yields further out along the curve are unlikely to decline as much—bullish curve steepening—so moving out into the belly (3-7 year) could deliver higher returns than remaining at the very front end.
Investors should stay cautious about moving far along the curve, as risks remain at the longer end. The fiscal position of the US is not expected to improve. Bloomberg’s consensus for the budget balance as a percentage of GDP has deteriorated from -6.2% in 2025 to -6.5% in 2026.1 Concerns about persistent inflation, coupled with perceived attacks on the independence of the Fed, continue to play on market participants’ minds.
UK: Stable, not strong
The UK’s monetary and fiscal issues seem to be an amplification of those in the US. Markets have priced very little policy easing—they don’t expect the next 25 basis points (bps) cut until April 2026—primarily because the CPI remains well above the Bank of England’s (BoE) target at 3.8% YoY.
We can look to the US market to get a hint of what to expect. In the first half of 2025, the US had relatively high short-end rates and limited expectations for policy easing, just like the UK now. Then, the front end of the curve provided the strongest returns.
The other reason to stick to the front end is fiscal risks with the UK Budget, scheduled for 26 November. Before the 2024 Budget, yields at the 30-year part of the curve increased by close to 50bps from their September lows.2 Such a dramatic move is unlikely to recur, but yields have been trending higher all year. The backdrop of heavy supply, the BoE selling gilts, and reduced pension fund demand for long-duration assets means the market has become acutely sensitive to hints that the government’s fiscal position may loosen.
Implementation ideas:
Do not over-stretch for yield
Credit spreads are tight, presenting risks if the economy loses momentum. These risks can be mitigated by sticking to high quality securities. Shorter duration and high carry investments, like Euro AAA-rated CLOs, can also help build a more resilient portfolio.
The European Central Bank’s (ECB) rate-cutting cycle is at or near its end. Policy rates of 2% make achieving an attractive running yield on EUR-denominated portfolios a key challenge for investors. Standard options include extending along the curve, which entails assuming higher amounts of duration risk, or lowering the portfolio’s credit quality. With credit spreads at historically tight levels, taking on lower-rated credit—which may be more volatile—can affect returns if the market goes risk-off. For example, April’s unexpected tariff announcement caused the option-adjusted spread on Euro high yield to surge from a low of 264bps in early March to over 460bps in early April.3 This represented a 3.75% decline in the Bloomberg Euro High Yield Liquid Total Return Index in the span of a little over a month. In contrast, over that same period, the Bloomberg Euro Aggregate Corporate Index, an investment grade (IG) exposure, dropped only 1.2%.
Go a tranche
Positioning at the front end of the IG curve makes sense from a resilience perspective but yields are limited.4 An alternative is to consider Collateralised Loan Obligations (CLOs), which have several advantages over fixed rate bonds (Figure 1):
- Higher yields: J.P. Morgan's AAA-rated Euro CLO Index offers a yield-to-worst of 3.13%. This is above money market rates (12-month Euribor is 2.2%) and exceeds or is close to the yield of broad investment grade corporate all maturity bond exposures.
- Shorter duration: CLO tranches are floating rate exposures, resulting in duration risk that is more aligned with the bill market. This structure helps reduce volatility and improve portfolio resilience. Given this duration and expected yield, CLOs offer a strong yield per-unit-of-duration profile.
- Higher quality: The tranche structure of CLOs enables investors to focus on the top, AAA-rated portion. This tranche of CLOs can improve portfolio credit quality.
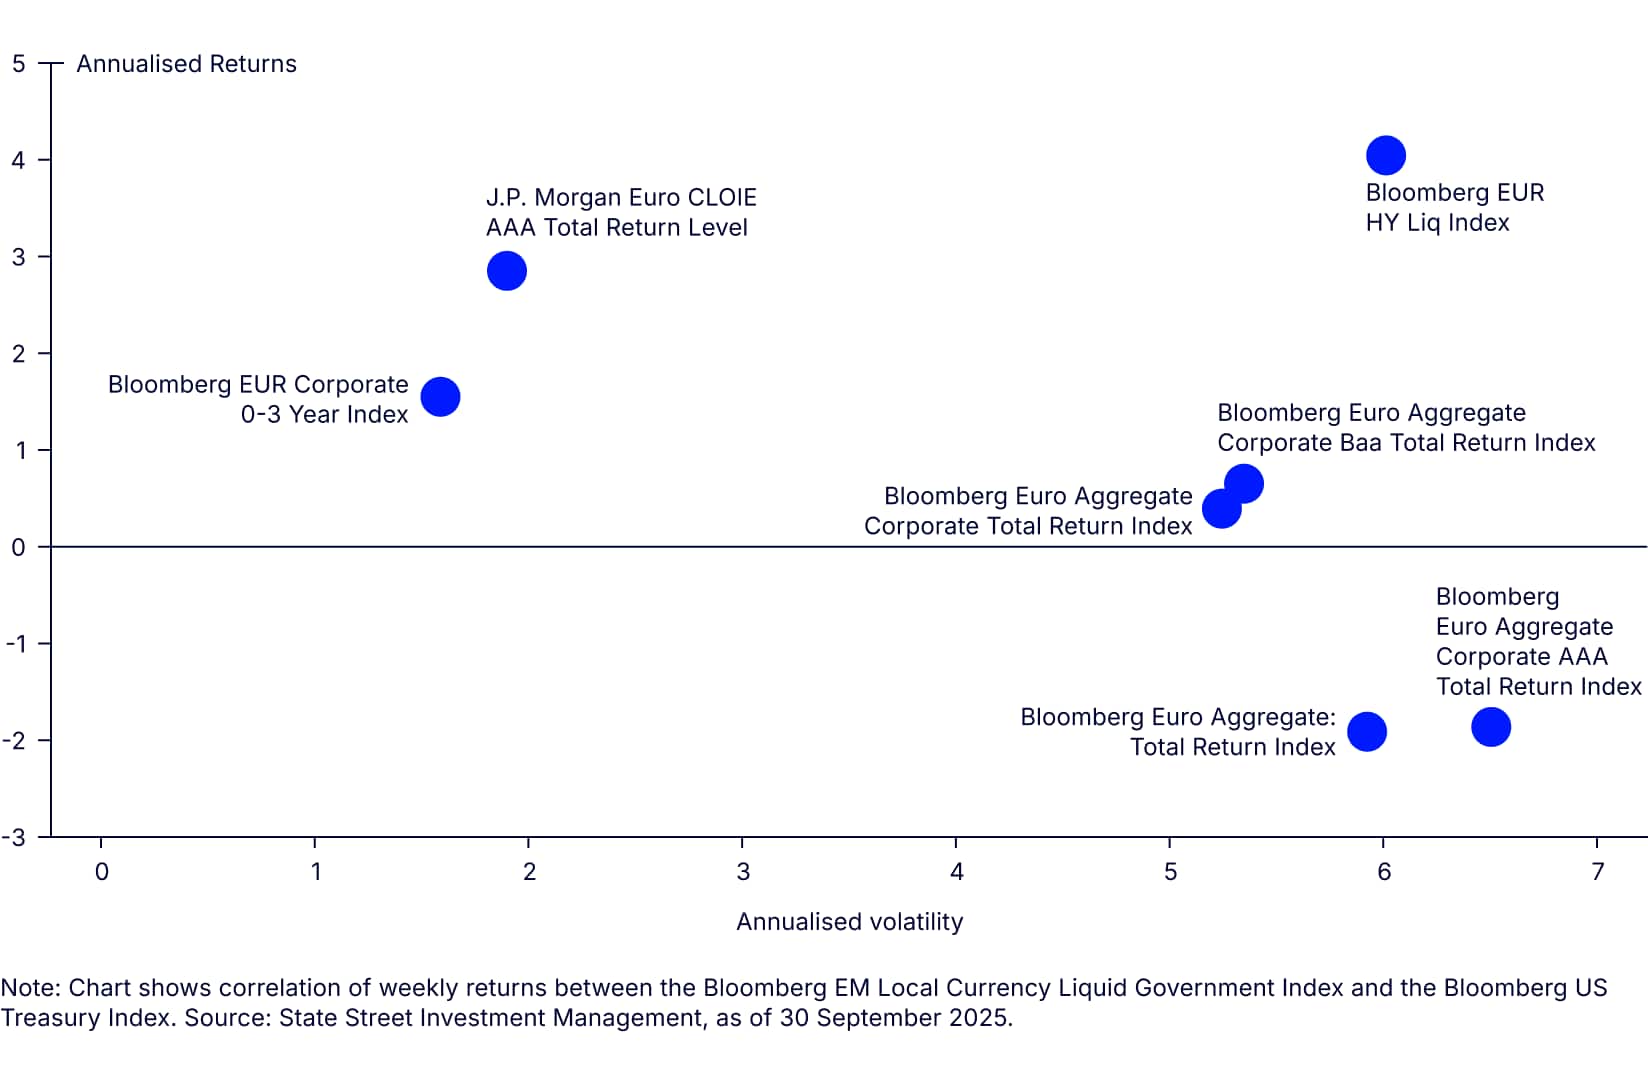
Figure 1: AAA-rated CLOs can enhance yield and reduce volatility
Short-end US investment grade credit
US IG credit still offers a relatively attractive all-in yield—the yield-to-worst on the Bloomberg US Corporate index is 4.8%.5 Historical analysis suggests that current credit spreads seem compressed, but investors have accepted this due to the attractive all-in yield. However, this positioning would introduce performance risks from spreads widening due to macro events like US employment indicators continuing to deteriorate.
Focusing on the shorter part of the curve is advisable for at least three reasons:
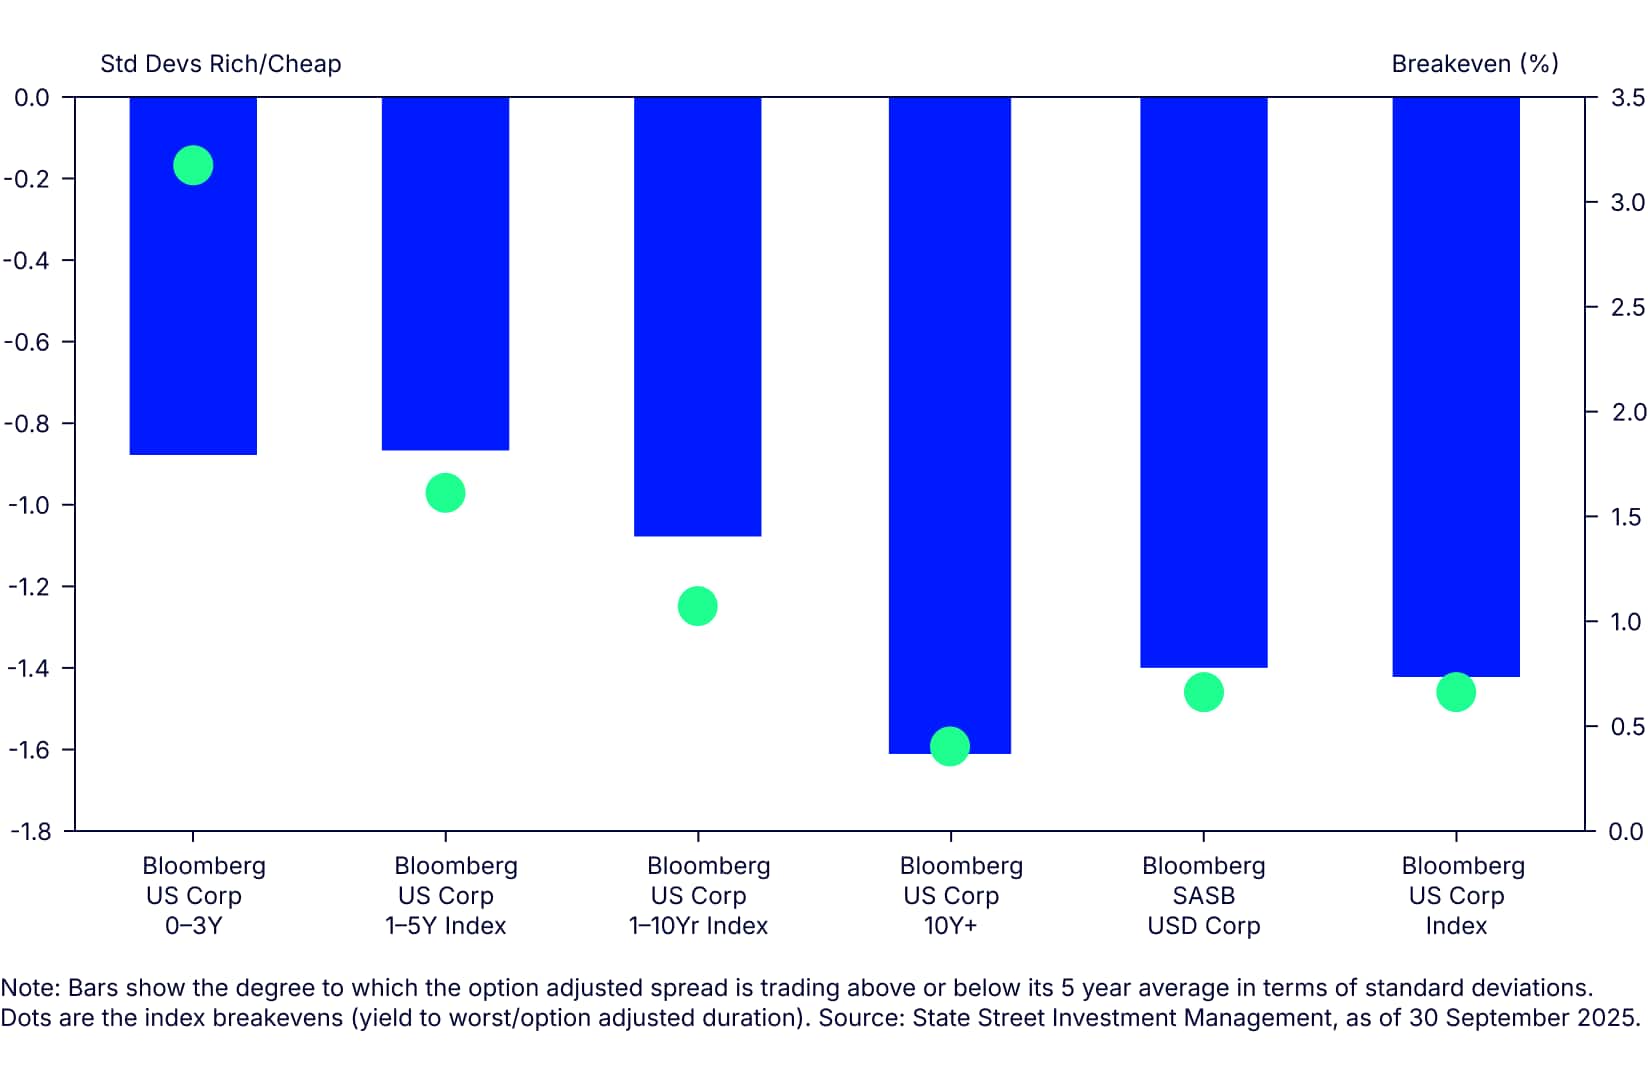
- Spreads look less compressed: Figure 2 illustrates Option-Adjusted Spreads for a selection of US IG indices, measuring the standard deviations from their five-year average. Short-dated exposures appear less stretched than their longer-dated counterparts.
- Higher breakevens: Dividing an index yield-to-worst by its duration gives an idea of the degree to which yields need to rise before the annual yield is wiped out. As shown in Figure 2, breakevens decrease as maturities lengthen along the curve.
- Reduced sensitivity to supply: Big moves in the underlying Treasury curve because of issuance can influence the credit curve. The front end of the curve is generally less sensitive to supply than long-dated credit.
Figure 2: Spread standard deviations rich/cheap to their 5-year average and breakevens
As noted in theme 1, the running yield at the very front end of the curve should decline as policy rates fall. Strategies that focus on the belly of the curve should suffer less as the curve is likely to steepen.
Implentation Ideas:
Diversification to support late cycle returns
As many asset classes appear richly valued, diversifying sources of returns becomes increasingly important in late stages of the cycle. Drivers of emerging market (EM) debt remain supportive, and strong risk appetite may support further gains for convertible bonds.
As we enter the late stages of the US economic cycle, it seems likely that markets will become more volatile. With the Fed heavily focused on the US labour market, any readings that contradict the narrative of a gradual economic slowdown are likely to force some re-pricing. In addition, credit spreads are quite constricted so there remains an asymmetric bias towards widening.
Several alternative strategies can be considered to counteract some of these risks.
Risk that the economy remains strong—convertible bonds
The strength of the US economy and the reluctance of the Fed to ease policy has been a constant drag on bond market performance since rates peaked in mid-2023. However, this strength has underpinned returns from equities and other risk assets. If earnings remain strong, it is likely that equities will continue to outperform bonds.
Convertible bonds can participate in equity upside and have provided strong returns so far in 2025. They provide a hedge against stronger drawdowns from pure equity indices, as seen during the Liberation Day sell off. Their relatively low interest-rate sensitivity makes them less vulnerable to volatility induced by fiscal deficit concerns and their impact on long bond yields. Convertibles provide added protection with its crossover quality profile, sector and issuers’ geographical exposure diversification: indeed, around 40% of the FTSE Qualified Global Convertible Bond Index securities are outside the US.
Valuations are slightly above the long-term average delta of the FTSE Qualified Global Convertible Bond Index — 56 as of September 2025 month end. Convertible bonds continue to offer a relatively balanced profile against a fall in equity market performance, and low interest-rate sensitivity.
Benefitting from ongoing USD depreciation — EM local currency debt
Emerging market local currency debt (EMD) is another asset class that showed strong performance in 2025. USD year-to-date returns for the Bloomberg EM Local Currency Liquid Government Index was 14.2%, of which approximately 6.4% was accounted for by USD depreciation.6
The depreciation of USD, partly driven by Fed rate cuts, can continue. The USD still looks close to 9% overvalued against the basket of currencies that make up the Bloomberg EM Local Currency Liquid Government Index based on the State Street Investment Management FX fair value model. Uncertain policymaking and instability at the longer end of the US Treasury curve may continue to weigh on the currency.
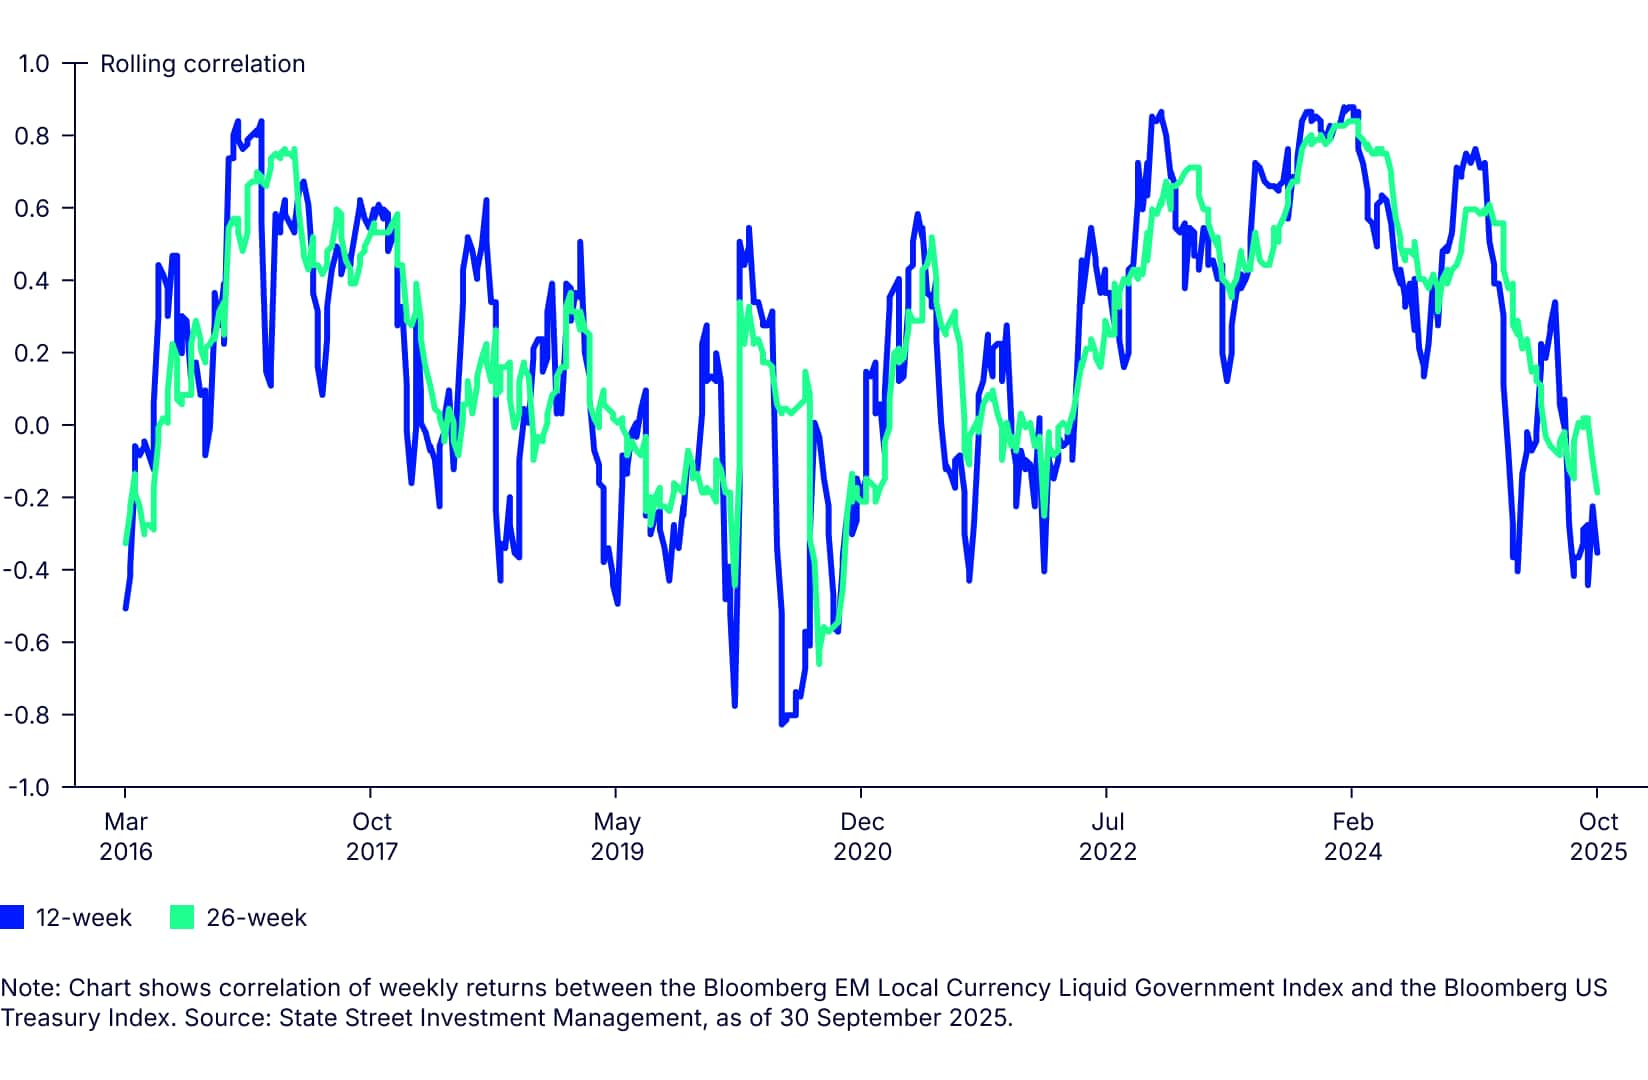
Figure 1: EM debt correlations to US Treasurys continue to weaken
In addition:
- Yields remain at attractive levels — 5.4% for the Bloomberg EM Local Currency Liquid Government Index. The coupon has provided investors with a 4% return over the first nine months of 2025.
- Lower US rates should allow EM central banks to cut rates. EM central banks have slowed the pace of easing, cautious that getting too far ahead of the Fed might weaken their currencies. This has resulted in rising real rates as inflation has declined, leaving ample scope to ease policy if the Fed continues to cut rates.
- Diversifying away from core rate products is supported by its declining correlations to US Treasurys. Over the past 12 weeks, the correlation of weekly returns of the Bloomberg EM Local Currency Liquid Government Index to Treasurys has actually turned negative (Figure 1)
Saudi Arabia bonds: Avoiding the deficit trap
Large, persistent budget deficits remain a critical bond market risk. It has affected longer-dated bond performance in several key markets. There are still parts of the debt ecosystem where debt to GDP ratios remain low. The Kingdom of Saudi Arabia has a gross debt/GDP ratio of just under 35%, and a rating of Aa3 from Moody’s and A+ from S&P and Fitch, which should reassure investors.7
10-year local currency denominated debt yields around 90bps above US Treasurys — but the Saudi Arabian riyal being pegged to the USD means there is no significant additional currency risk for investors.
High issuance is part of a broader strategy to build liquidity in the Saudi market. This appears to be paying off—Saudi local SAR-denominated bonds were recently placed on index watch-positive for inclusion in the J.P. Morgan GBI-EM Index. This means the Saudi Riyal-denominated sovereign sukuk (SAR Sukuk) bonds are in the final review phase for potential inclusion in the local currency J.P. Morgan GBI-EM series of Indices. The assessment period is expected to last six to nine months, so inclusion could start as early as the end of Q1 2026.
Saudi Arabia would have an estimated index weight of 2% in the J.P. Morgan GBI-EM Global Diversified Index. This relatively modest start could still generate significant inflows given the low levels of bond ownership beyond Saudi domestic investors.
Currency risks
Given the risk of continued USD depreciation, non-USD-based investors should consider currency-hedged share classes. There is a cost to hedging but it allows investors to obtain returns that are more in line with the fund’s base currency. For example, the Bloomberg EM Local Currency Liquid Government Index has returned 14.24% year-to-date in USD terms. For Euro-based investors, nearly all of this gain would have been wiped out by USD against the EUR. However, the EM Local Currency Liquid Government USD base hedged to EUR index has returned 12.11%—85% of the USD-denominated return.
Implementation Ideas: