The power of information ratio (IR) in active management
When evaluating active managers, investors review countless metrics. If you had to focus on just one, information ratio is a good place to start—capturing how efficiently a manager converts active risk into consistent value added.

When conducting investment manager due diligence, investors are typically presented with a broad array of materials: historical performance, attribution analyses, risk statistics, philosophy statements, and detailed descriptions of investment processes. While each of these inputs plays an important role, it can be useful to step back and frame the evaluation more simply. If you could ask a portfolio manager for just one metric to assess their fund, one metric stands out: the information ratio (IR).
The IR stands out because it speaks directly to the central objective of active management: delivering excess returns in a disciplined, efficient, and repeatable manner. It shifts the focus away from absolute outcomes and toward how effectively a manager converts active risk into value added.
Why the information ratio matters
By definition, active management involves deviating from a benchmark. The relevant measure of success isn’t whether returns were high in absolute terms, but whether those deviations from the benchmark generated attractive risk‑adjusted excess returns. The statistic specifically designed to address this question is the IR.
The IR measures the amount of excess return a manager produces per unit of active risk, where active risk is defined as tracking error relative to the benchmark, or the volatility of excess returns. In simple terms, it evaluates how efficiently a manager’s active decisions have paid off.
Information ratio versus Sharpe ratio: What’s the difference?
Both the IR and the Sharpe ratio are measures of risk‑adjusted performance, but they adjust for different sources of risk and are suited to different analytical purposes.
- The Sharpe ratio measures excess return per unit of total volatility relative to the risk‑free rate. When the risk‑free rate is close to zero or constant over the period, the Sharpe ratio effectively becomes the portfolio’s return divided by its standard deviation
- The IR, by contrast, measures excess return relative to a benchmark per unit of active risk, defined as the volatility of excess returns. Rather than evaluating whether an investment was attractive on a standalone basis, it assesses whether active decisions added value relative to a chosen index
Figure 1: Sharpe ratio and information ratio formulas
| Information ratio | Sharpe ratio |
(Portfolio return – Benchmark return) / Standard deviation of (Portfolio return – Benchmark return)* *Also known as the “tracking error” or “active risk” | (Portfolio return – risk free rate) / Standard deviation of (Portfolio return - risk free rate)
|
Source: State Street Investment Management.
These two metrics are best viewed as complementary rather than competing. A strategy can exhibit strong efficiency relative to a benchmark, reflected in a high IR, yet deliver weaker risk‑adjusted performance relative to cash, reflected in a lower Sharpe ratio. Importantly, asset class characteristics and prevailing market conditions often drive Sharpe ratios more than the quality of active decision‑making itself.
Figure 2: Key features of information ratio vs. Sharpe ratio
| Sharpe ratio | Information ratio | |
| What it measures | Risk‑adjusted return relative to a risk‑free rate | Risk‑adjusted active return relative to a benchmark |
| Core question | “Was I compensated for the total risk I took?” | “Did the manager add value relative to the benchmark, consistently?” |
| Return used (numerator) | Portfolio return minus the risk‑free rate | Portfolio return minus benchmark return |
| Risk used (denominator) | Volatility of excess return relative to cash or risk-free rate | Volatility of excess return relative to benchmark (also known as Tracking error) |
| Type of risk captured | Total risk (market + idiosyncratic) | Active risk (deviation from benchmark) |
| High value means | Strong returns relative to overall volatility; efficient risk taking | Consistent, skill‑based outperformance versus benchmark |
| Low value means | Returns did not justify the volatility taken | Little, inconsistent, or negative value added vs. benchmark |
| Negative value means | Underperformed the risk‑free rate | Underperformed the benchmark |
| Best used for | Comparing portfolios, funds, or strategies across asset classes | Evaluating active managers within the same benchmark |
| Benchmark sensitivity | Low (only depends on risk‑free rate) | High (results depend heavily on benchmark choice) |
| Strengths | Simple, intuitive, broadly comparable | Focuses directly on manager skill and consistency |
| Limitations | Treats upside and downside volatility equally; can be inflated by smooth returns | Can penalize managers with high conviction; benchmark choice matters |
Source: State Street Investment Management.
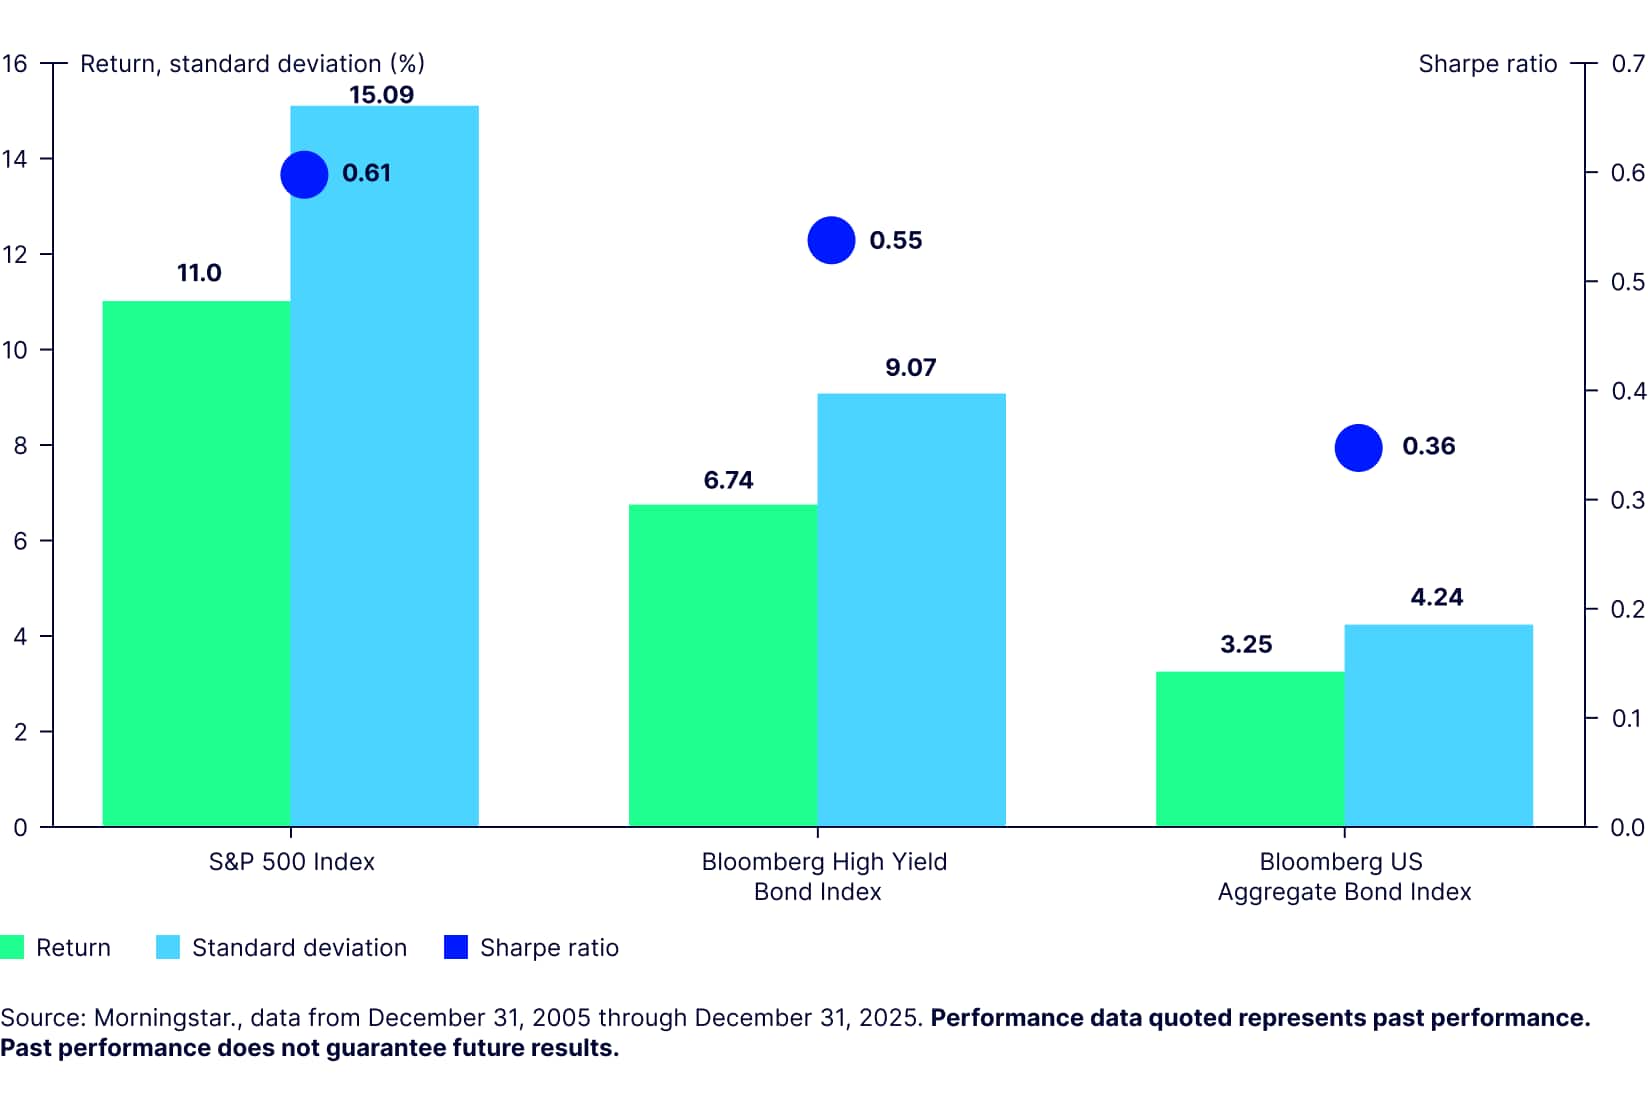
Reflecting greater return potential relative to volatility, riskier asset classes such as equities and high‑yield credit have tended to exhibit higher Sharpe ratios than high‑quality bonds over long horizons (Figure 3). This pattern helps explain why Sharpe ratios often vary more across asset classes than across managers within the same asset class.
Figure 3: 20-year Sharpe ratios
What’s a “good” information ratio?
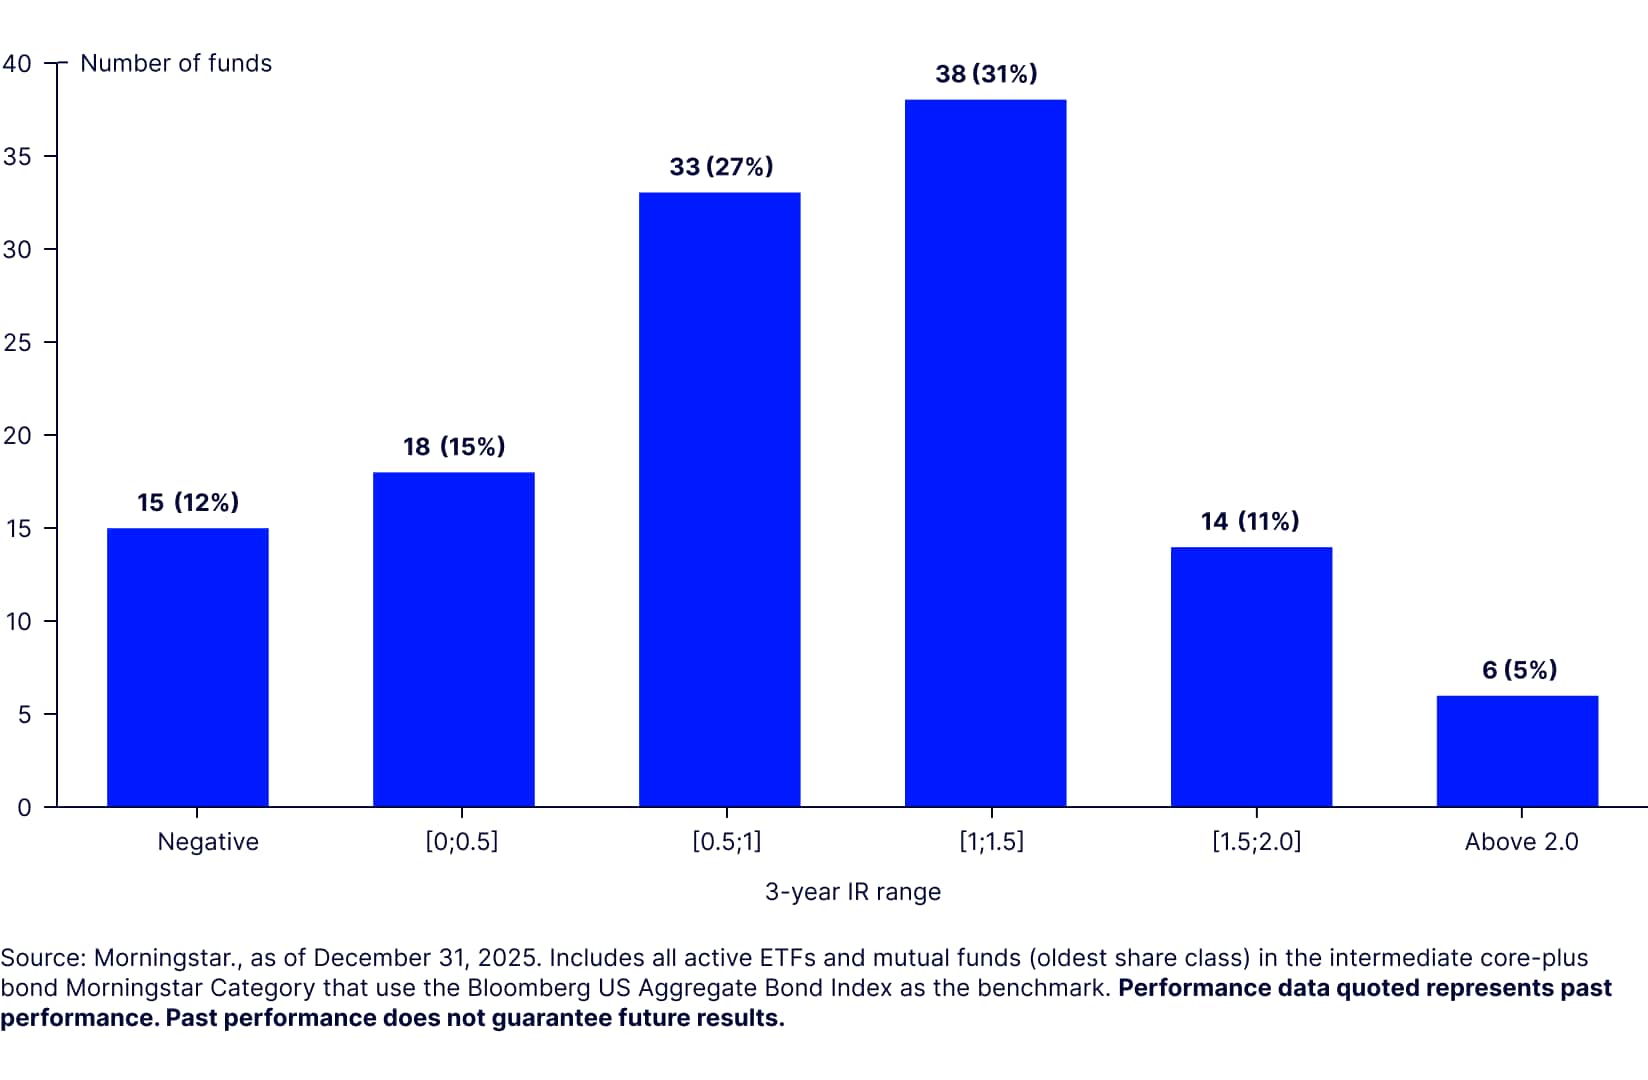
Information ratios above 0.5 are often viewed as reflecting solid skill, while values above 1.0 are often seen as indicating strong, consistent value added. Figure 4 shows the distribution of 3-year IRs for all active core-plus bond ETFs and mutual funds that use the Agg as benchmark.
Across the category:
- 12% of funds posted negative IRs1
- 74% generated IRs above 0.52
- 47% exceeded 1.03
- 16% surpassed 1.5, and4
- Just 5% achieved IRs above 2.05
While positive IRs are relatively common in core-plus fixed income, outcomes above 2.0 remain rare, reflecting an unusually efficient conversion of active risk into excess return, placing a strategy in the extreme right tail of the distribution.
Figure 4: 3-year IR distribution across active core-plus bond managers
Example of information ratio from active core‑plus fixed income
Consider two active core‑plus bond managers, both benchmarked to the Bloomberg US Aggregate Index.
- Manager A takes off‑benchmark positions that are similar in risk to the benchmark, such as allocations to investment‑grade credit. As a result, tracking error remains relatively low
- Manager B takes off‑benchmark positions primarily in high‑yield credit, introducing materially different and more volatile risk exposures. Tracking error is therefore significantly higher
Assume Manager A generates 2.0% of excess return, while Manager B generates 2.2%. Although Manager B produces slightly higher excess return, that outcome is achieved with a disproportionate increase in active risk. Manager A therefore exhibits a meaningfully higher IR.
The implication is not that one manager is categorically “better,” but rather that Manager A delivered excess returns more efficiently relative to the benchmark. This efficiency of active risk‑taking is precisely what the IR is designed to capture.
Because higher‑yielding asset classes have historically exhibited stronger Sharpe ratios than core bonds, many core‑plus managers have relied on high‑yield exposure as a source of excess return. While this approach can improve headline performance metrics, it often does so by materially increasing tracking error.
A more demanding outcome is achieving comparable excess returns through diversified sources of alpha with risk profiles more closely aligned to the core bond benchmark. When successful, this approach can result in both competitive Sharpe ratios and higher IRs.
How information and Sharpe ratios shape active risk allocation
Category‑level evidence reinforces these distinctions. Across broad equity categories, average IRs have often been negative over multi‑year horizons. That means the average active equity fund has struggled to deliver positive excess returns relative to the excess risk taken versus their benchmark.
By contrast, several fixed income categories have exhibited positive average IRs (Figure 5), suggesting a more favorable opportunity set for active management.
These observations help explain how many institutional investors allocate active risk. In equities, long‑term asset class Sharpe ratios have been relatively high while average IRs have been low, making passive exposure an efficient default choice for many portfolios.
In fixed income, the opposite has often been true, a pattern that is evident in the rolling IRs (Figure 5), supporting a greater role for active management. When comparing the core categories of US large blend and intermediate core-plus, bonds have a greater consistency of positive IRs than stocks do in these core categories (Figure 6). As a result, many investors allocate a larger share of their alpha budgets to fixed income strategies, while relying more heavily on passive exposures in equities.
Information ratio can add the right information
Risk‑adjusted performance is the appropriate objective in active management, but it must be evaluated relative to the correct reference point. The Sharpe ratio is well suited for comparing asset classes and assessing standalone investments. The IR addresses a more targeted and often more relevant question: How efficiently does a manager convert active risk into excess return?
Viewed through this lens, the IR is not the only question worth asking in manager due diligence, but it is frequently the right place to begin.
Looking for more on active investing? Explore our latest insights.