Gold 2026 Midyear Outlook: A tug-of-war between tactical and structural momentum
After a volatile but strong start to 2026, gold prices are consolidating around $4,400-4,700/oz1 amid competing macro forces tied to the Iran conflict and higher oil prices. This makes for a tactically challenging environment entering the second half of 2026.
For investors, that argues for patience tactically—and continued consideration of gold as a strategic diversifier as structural demand remains intact.
Structural demand persists despite oil-driven volatility
Over the medium to longer term, spot bullion demand may benefit structurally from the consequences of the Iran conflict. Geopolitical fragmentation could accelerate, supporting bullion consumption among private entities and central banks that seek alternatives to USD and continue to onshore hard assets. Additionally, war spending in the US and energy subsidies across emerging market economies are likely to exacerbate government deficits and debt loads amid a renewed inflation impulse, potentially benefiting gold as a hedge against declining fiat purchasing power. Finally, if the oil price shock continues to dominate macro sentiment in H2, the risks to global growth and asset market returns could tilt downwards. That could benefit gold as a counter-cyclical hedge.
The direction of oil prices may thus have an outsized impact on gold for the balance of 2026. A normalization of ICE Brent trading to $80/bbl could push gold to $5,000/oz via the US Federal Reserve (Fed) expectations and USD channel. On the other hand, triple-digit oil prices and the tail risk of $150/bbl crude could be a headwind for gold, in our view, prompting gold to test $4,000/oz support levels.
ETF flows reflect this dichotomy. Following a record seasonal inflow in USD notional terms in January/February of this year, March saw record redemptions led by Western tickers, even as Chinese ETF investors kept buying.2 Q2 bullion ETF flows have since stabilized, as investors cautiously await clarity on both foreign and monetary policies.
Four factors shaping gold’s strategic outlook
1. Demand for monetary hedges and debasement risks. As record debt and sticky inflation keep long-term yields higher, gold can be an attractive potential hedge against duration exposure and currency debasement.
Global debt hit a record $353 trillion at the end of Q1 2026, more than 3x world GDP. More importantly, the government share of that debt also hit a record 31%.3 Elevated sovereign debt loads raise concerns for investors about diminishing purchasing power, constrained fiscal space, and structurally higher borrowing costs. While the oil price spike may weigh on gold in the short term via the USD and Fed, the medium-term outlook remains supportive.
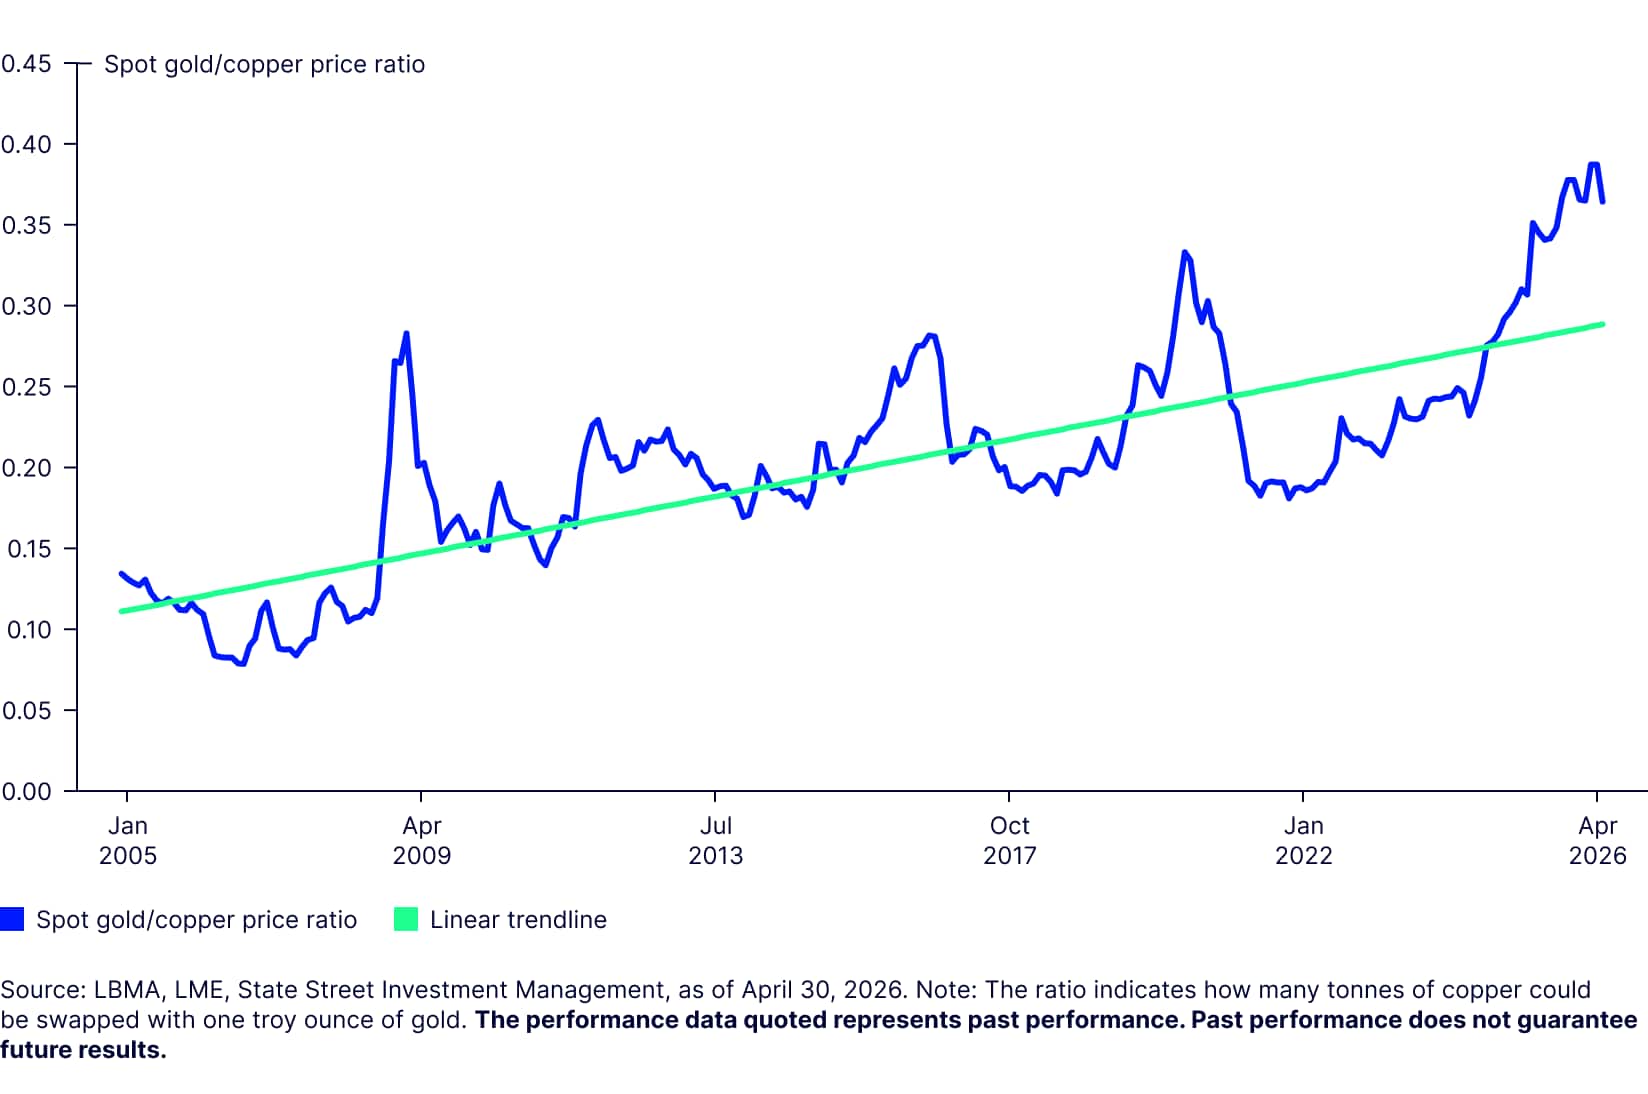
The recent rise in the spot gold/copper ratio illustrates gold garnering greater demand as a monetary hedge. The move in the price ratio from below 0.25 in Q4 2023 to above 0.38 in H1 2026 is historically strong but structurally slow. Rapid jumps in the ratio over the past quarter-century were crisis-driven, peaked within 12 months, and coincided with contracting copper consumption and weakening global growth sentiment.4 But the ratio has been rising with both metals on a bullish uptrend since 2023, implying a meaningful repricing of monetary risk and potential debasement fears—not deflationary fears—ahead.
Figure 1: Spot gold/copper price ratio (2005-2026)
2. Elevated stock/bond correlations. Gold’s role as a portfolio diversifier should be magnified as investors seek alternatives to traditional 60/40 or 70/30 portfolios.
US stock/bond correlations are positive, following a ~25-year period from the late 1990s to the early 2020s when market returns showed a broadly inverse relationship.5 Even as correlations have eased somewhat in 2025-2026 from the 2022-2024 peaks, they remain historically strong.6 Given inflation risks, higher neutral rates, and ongoing government borrowing, we think there is a risk that stock/bond correlations have entered a new post-pandemic regime. That leaves room for investors to implement liquid alternatives like gold as left-tail diversifiers in portfolios. An anchored inverse USD/gold relationship, which ties into the monetary hedge demand for bullion, further supports this narrative.
3. Physical demand is still strong globally. While financial gold demand in the West may ebb and flow with periods of risk-on/risk-off or Fed pivots, the yellow metal is ultimately a “physical” commodity asset with diverse sources of global demand from China retail and global central banks that can underpin price support.
Gold bar/coin demand in Q1 2026—inclusive of the first month of the Iran conflict—was up 42% year-over-year to 474 tonnes (t), the second-highest quarter on record.7 Chinese retail consumption was solid, with non-monetary imports averaging 123.1t/mo during Q1 2026, up from 55.5t/mo in Q1 2025—despite the 70-80% increase in spot prices.8 The official sector also purchased 244t of gold in Q1 2026, up 3% from Q1 2025, offsetting some sales from Turkey, Russia, and other central banks.9 Strong physical investment demand for gold is preferable for bullion bulls, as it tends to be more price inelastic vis-à-vis jewelry consumption. As Trump 2.0 policy potentially increases geopolitical fragmentation, gold might benefit as a “neutral” store of value.
4. Gold can be ‘over-bought’ at times, but not ‘over-owned’. Despite the historic ~150% rally in the gold price from 2023 to 2026, global gold fund holdings as a percentage of worldwide mutual fund and ETF assets stood at 1% at the end of April10—well-below the 3-10% strategic target allocation we find suitable for most portfolios.
In our view, this provides plenty of scope for gold allocations to increase in 2026-2027. Investors may look to add strategic gold holdings as the metal has historically shown low correlation to traditional assets and has a stable price volatility profile compared to other alt-fiat proxies like silver or bitcoin.11 Strategic gold allocations may also increase for duration or global growth hedges.
Gold and the rise of unmonetized fiscal pressure
The current policy backdrop reflects a growing tension between balance sheet normalization and rising fiscal pressure. As total public debt continues to grow while the Fed reduces its balance sheet, private investors must absorb a larger share of Treasury issuance rather than central banks. We define this widening gap as unmonetized fiscal pressure—total public debt minus Fed assets, each expressed as a share of GDP.12
This measure has risen from roughly 50% of GDP in the early 2000s to more than 100% today, highlighting the growing amount of government debt that must be financed at market clearing rates (Figure 5). Simultaneously, federal net interest expense as a share of GDP has reached its highest level in decades—increasing the fiscal outlook’s sensitivity to interest rate levels.13
A potential transition to a more hawkish Fed under incoming Chair Kevin Warsh could reinforce these dynamics. A policy mix of restrictive interest rates and continued balance sheet reduction would increase the amount of Treasury issuance requiring private absorption. While this outcome is sustainable if nominal growth remains strong and investor demand for Treasurys holds, persistently large deficits may require higher yields to attract capital, further compounding borrowing costs. Prolonged balance sheet contraction may become increasingly difficult to sustain as the debt and interest burden rises.14 In our view, gold’s rise in recent years may reflect markets pricing this dynamic; quantitative tightening as cyclical, fiscal expansion as structural.
These forces carry implications for USD. Sustained fiscal deficits and rising debt-service costs could weigh on long-term currency confidence—particularly if markets begin to price a shift toward more accommodative monetary policy over time. A renewed period of dollar weakness could serve as a meaningful tailwind for gold, as it did in 2025.15
Against this backdrop, gold warrants consideration as a strategic portfolio allocation. Historically, gold has performed well during periods of elevated fiscal pressure, rising interest costs, and monetary policy uncertainty.16 As we see it, gold may serve as a strategic diversifier and a potential hedge against the convergence of rising debt levels, growing interest costs, and a more constrained monetary policy backdrop.
As for the very short-term, a key risk to gold would be a more hawkish Fed response to persistent inflation, particularly if resilient growth keeps real yields elevated for longer. However, the more constructive backdrop for gold may be a stagflationary environment in which labor markets weaken while inflation pressures remain elevated through 2027. In that scenario, the Fed could face growing pressure to ease policy despite inflation remaining above target. On balance, that combination of weaker growth, sticky inflation, and eventual policy easing would likely be supportive of gold.
Central banks: Gold’s reserve role deepens as USD share declines
Central banks continue to buy bullion, with demand accelerating in Q1 2026 despite tactical sales from Turkey and Russia. Rather than weakening the official sector trend, these sales may reinforce gold’s strategic role as a reserve asset that can be mobilized during periods of geopolitical stress and liquidity pressure. In our view, that reserve utility remains incrementally bullish for official sector demand over time. We expect continued accumulation from central banks in 2026, marking the 17th consecutive year of net purchases since the Global Financial Crisis and providing a durable floor for the yellow metal.17
Despite some selling activity last quarter, central banks purchased ~244t of gold on a net basis in Q1 2026, as overall gold demand reached a record high by value ($193 billion).18 Net official-sector buying was:
- Up 17% vs. the prior quarter (208t)
- 8% above the five-year quarterly average (~226t)
- 3% higher year-over-year (237t).19
Emerging market central banks continue to drive official sector demand. For example:
- Poland: The Narodowy Bank Polski, the largest gold buyer in 2025 and year-to-date (YTD), purchased 31t over Q1 2026, lifting total reserves to 582t. Governor Adam Glapiński has acknowledged the possibility of some gold sales, but the central bank continues to emphasize its 700t target20
- Uzbekistan: The Central Bank of Uzbekistan accumulated 35t in the first three months of 2026, raising its gold holdings to 416t, accounting for 87% of total holdings21
- China: The People’s Bank of China increased their gold reserves for the 18th consecutive month, after adding 8t in April 2026. Their gold reserve stockpile now sits at 2,322t, now accounting for ~9% of China’s foreign exchange reserves22
Nations bearing the implications of the current energy price shock have utilized gold’s strategic reserve role as an accessible source of liquidity amid heightened geopolitical uncertainty. A sizable 115t of gold sales were reported in Q12026, with notable outflows from Turkey and Russia.23 Turkey, one of the world’s most aggressive bullion buyers over the past decade, was the largest seller of gold in 2026, tactically selling and swapping $10 billion (~70t) of gold to defend the lira and meet liquidity needs amid war-related volatility, surging energy import costs, and broader funding pressure.24 That policy response was not limited to gold, as Treasury securities attributed to Turkey also fell ~89% in March, from $15.72 billion to $1.78 billion.25
Russia has also used its gold reserves to help shore up the economic costs of its now fourth year of war with Ukraine, selling ~22t of gold to help plug a widening military-driven budget deficit, cover higher energy costs, and support its domestic currency.26 In our view, these developments show that gold’s value to reserve managers extends beyond appreciation, but also as a liquid reserve asset that can support balance sheets, support funding needs, and provide insulation from external policy risk in a more geopolitically fragmented world.
With the rise of American hegemony came a greater share of USD in global reserve portfolios, eventually peaking at roughly 62% near the turn of the century.27 Since then, gold has steadily taken market share from the dollar, closing the gap between the two reserve assets to ~10 percentage points, with the dollar’s share falling to ~40% (its lowest level since 1993) while gold’s share has risen to ~30% (its highest level since 1991).28 The expanded use of sanctions policy (e.g., Russia, Iran, Venezuela) has reinforced the appeal of gold as an alternative reserve asset outside the dollar system—a secular tailwind that we expect to continue.
To evaluate the potential demand impact, we modeled the latest reporting from central banks under scenarios in which gold rises to 20%, 30%, and 40% of their total reserves. Under an additive reserve assumption, where new gold purchases increase both gold holdings and total reserves, these scenarios imply an additional $1.05 trillion to $4.35 trillion of potential gold purchases, equivalent to roughly 7,008t to 28,984t.29 Rather than a precise forecast, the scenario range illustrates the scale of potential demand still embedded in under-allocated reserve holders—and why continued convergence toward higher gold allocations could support a higher gold price regime.
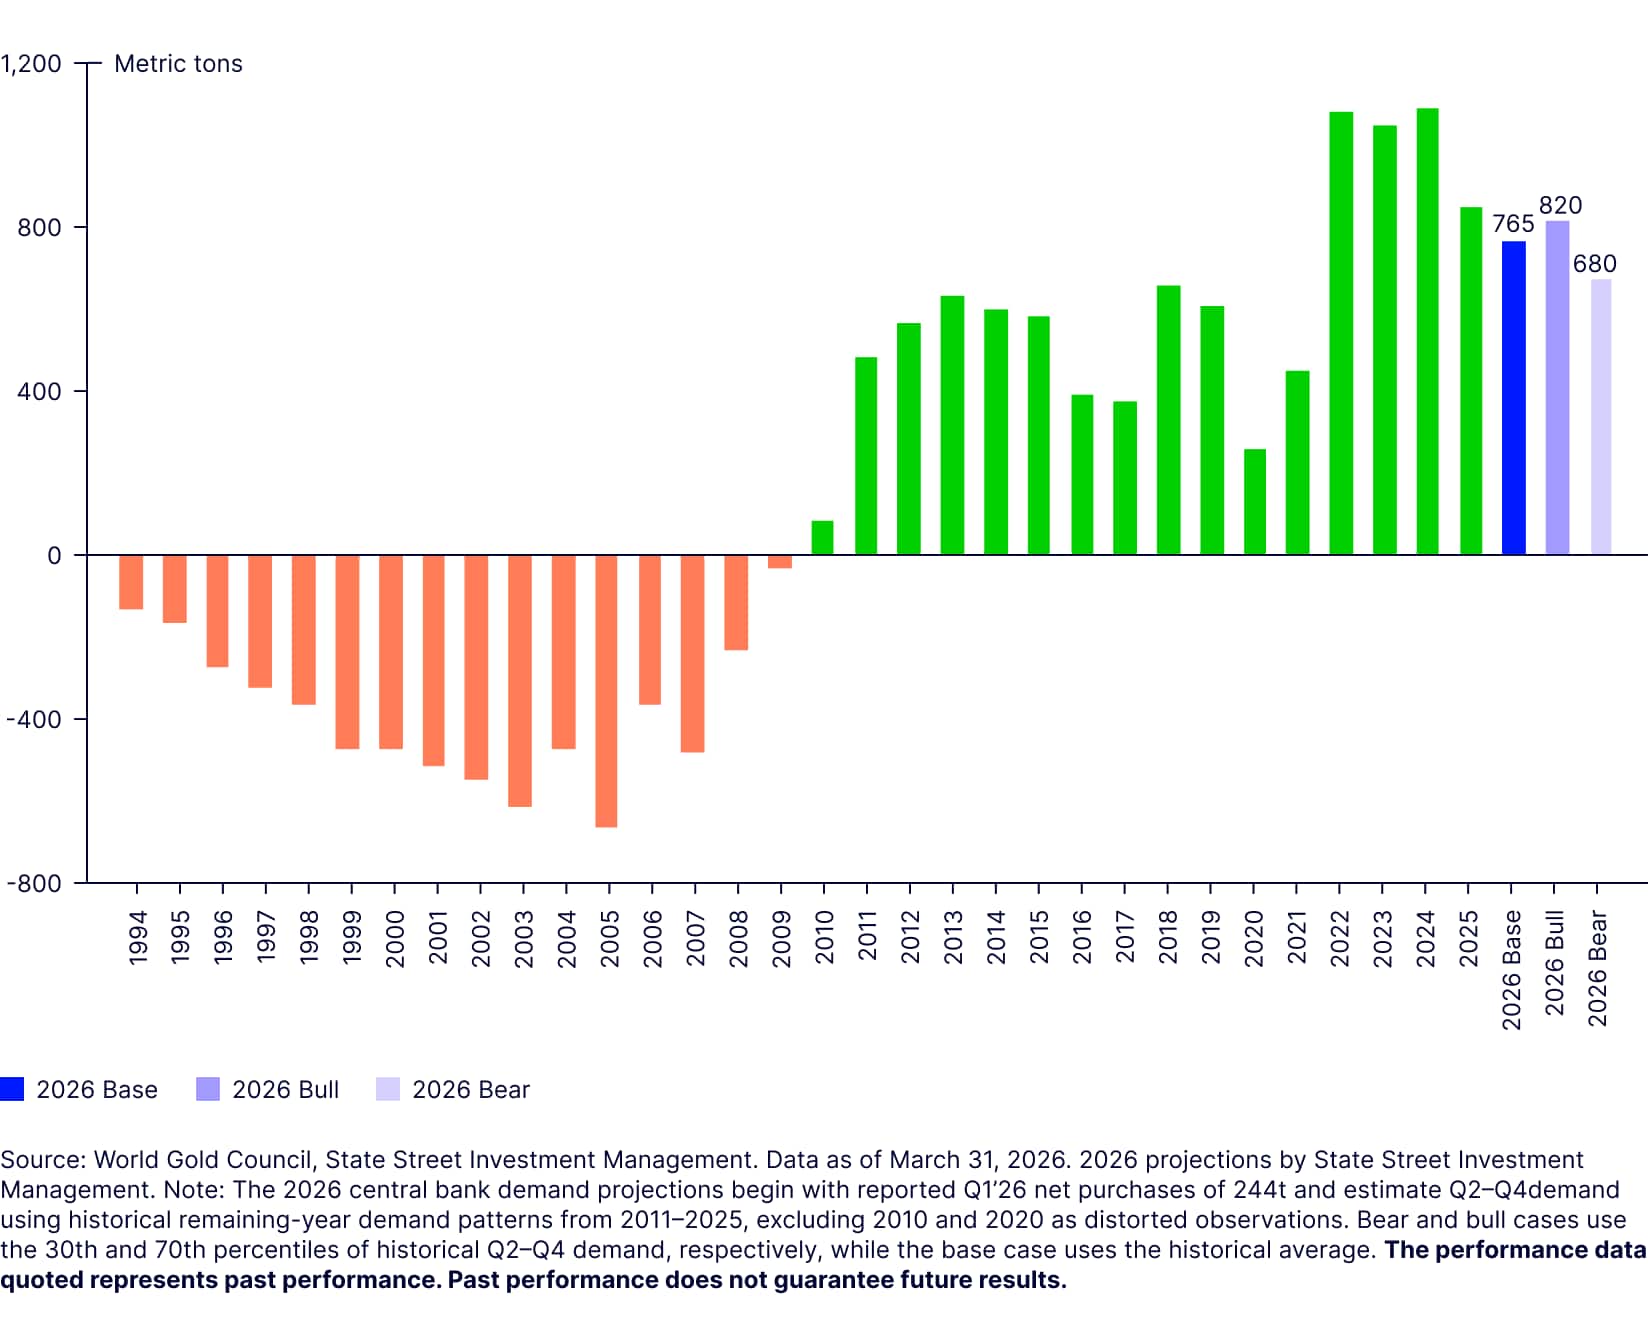
To estimate 2026 central bank demand, we began with 244t reported through Q1 2026 and projected Q2-Q4 using historical remaining-year demand patterns. The model implies FY26 demand could range from ~680t to ~820t, with a base-case estimate near 765t.30 This would keep official-sector gold demand elevated by historical standards, while reflecting some moderation from the record buying pace seen in 2022-2024.
Figure 7: Central bank net purchases since 1994, with 2026 projections
APAC emerges as a key driver of incremental demand
Regulatory and market initiatives in APAC are broadening participation across retail, institutional, and official sectors, creating more structural demand channels alongside traditional macro tailwinds.
YTD, APAC-domiciled gold ETF inflows have reached $16.2 billion (100t), accounting for 82% of global gold ETF net inflows.31 We expect these markets to drive structural demand in the years ahead:
China: Regulatory and market developments are reinforcing gold’s role in domestic portfolios. The insurer pilot allowing up to a 1% allocation supports institutional adoption, with scope to expand. Limited real asset alternatives and a multi‑year property downturn remain supportive of gold demand; Chinese and Hong Kong domiciled gold ETFs have attracted $9.7B (58t) YTD, accounting for 49% global net inflows.32
Reserve diversification continues to support central bank demand, reinforcing a constructive outlook for Chinese investors. In parallel, Hong Kong initiatives are improving access, liquidity, and cross border connectivity, supporting regional physical and ETF inflows.
India: Policy measures are improving access to gold investment products, while simplified tax rules are encouraging broader adoption of gold‑linked instruments. At the same time, India’s current account pressures are becoming harder to ignore, with the current account deficit projected to widen to 2.3% of GDP in FY27 from an estimated 0.9% in FY26, driven largely by elevated crude oil price pressures. Strong domestic consumer demand for gold adds to this deficit as it can put pressure on the rupee and drain foreign exchange reserves. The pressure on the rupee has been visible, weakening ~6% against the dollar this year, making it the worst performer among major Asian currencies and falling to a record low. With gold ranking in India’s top three inbound shipments in FY2025-26 (~$72 billion), policymakers in India have more than doubled import tariffs on gold as Prime Minister Modi has urged citizens to curb gold purchases for at least a year.33
Still, efforts to financialize gold demand remain supportive over the medium term. Allowing gold ETF allocations of up to 1% in public pensions and 5% in private pensions could also drive more structural demand. We estimate a 1% allocation from India’s public pension system could add incremental demand equivalent to ~1% of gold investment demand.34 Supported by policy tailwinds, India domiciled ETFs have attracted $3.6 billion (22t), representing 18% of global net inflows.35
Japan: Low real rates, fiscal dynamics, and currency weakness continue to support gold’s investment case. The Bank of Japan has revised down FY2026 growth to 0.5% (from 1%) while projecting core CPI at 2.5-2.7%,36 pointing to a stagflationary backdrop that is typically negative for cash and bonds but supportive for gold. At the same time, tax incentives are broadening gold investment participation across retail and asset managers, while still low or near zero institutional allocations point to further upside potential. Rising awareness is accelerating gold ETF and investment trust management funds (ITMs) adoption as preferred vehicles, with combined inflows reaching $5.0 billion (34t) YTD.37
Singapore: In March 2026, Singapore reinforced its positioning as a regional gold hub through policy and market infrastructure initiatives,38 strengthening its global role and supporting rising official sector engagement.
Overall, policy led developments are expanding gold’s investor base across APAC. Improved access and deeper investor adoption are lifting the region’s share of global demand in 2026, supporting a more durable and diversified demand profile.
2026 gold price outlook: Base, bull, and bear cases
Base case (70% probability): $4,750-$5,500/oz:
High oil prices and a Fed potentially on hold for longer could cap gold price cheer. But structural factors and low financial ownership should support ongoing strategic allocations in the ETF and physical market.
Bull case (15% probability): $5,500-$6,250/oz:
A significant dovish pivot from the Fed and the USD resuming its multi-year downtrend would likely put $6,000/oz gold back in play, as was the case pre-Iran conflict.
Bear case (15% probability): $4,000-$4,750/oz:
Higher oil prices and a Fed potentially introducing hikes could test gold market resilience at $4,000/oz even if Chinese investors and central banks remain buyers.
(Contributors: Aron Chan, Japan Gold Strategist)
Get more insights from our Gold Strategy Team.