Considerations for a long-dated US Treasury exposure
US Treasuries offer nuanced risk mitigation benefits in multi-asset portfolios, balancing downside protection (and healthy return potential) against sensitivity to fiscal risks. This can particularly be the case for longer-dated US Treasuries (debt with maturities of 10 years or more). However, as reflected in our midyear Global Market Outlook, we currently prefer short and intermediate-dated Treasuries given investors could demand significantly higher compensation at longer maturities if fiscal matters remain unaddressed. While not our core scenario, this is a tail risk for the long end.
In considering the pros and cons of a longer-dated Treasury exposure in multi-asset portfolios, we consider the historic performance of the segment, the improved risk/return profile of the overall Treasury market, and use some forward-looking scenario analysis and stress testing to help investors frame a decision around strategic allocations.
Mapping historical performance: risk and return
The question of whether to use an all-maturity or long-dated US Treasury exposure is an important one for equity investors seeking suitable risk mitigation. The historic performance of these two maturity segments can provide some valuable insights on their respective advantages and disadvantages. Figure 1 shows the yield response of the two segments whenever the S&P 500 index suffered a quarterly loss of 10% or more during the last forty years. The reaction has been similar for both across the various US equity market corrections — the median move for the all-maturity benchmark (Bloomberg US Treasury Index) yield is -67 basis points, while the median for the US Long Treasury index (Bloomberg US Long Treasury Index) is -64 basis points.
For investors, the key from a risk management perspective is understanding how those basis points moves translate into total return. This is where the long-dated US Treasury exposure, with its significantly higher duration, has proven to be a much more effective hedge during the majority of US equity corrections. As the table in Figure 2 illustrates, long US Treasuries had an average return of 8.1% during those quarters, while the parent US Treasury benchmark provided a still compelling average return of 5.1%. Long Treasuries have historically provided a more efficient use of capital — an unleveraged investor would have required an additional 60% allocation of capital to produce the same degree of risk mitigation. As part of this analysis, we also considered the impact of two other exposures: Global Treasuries and Gold. Global Treasuries offered a modest return for investors looking to manage equity risk during this period. In stark contrast, gold was clearly a viable alternative: although the sample size is modest, gold (as measured by the Bloomberg Gold Subindex Total Return Index) had only one negative outcome and provided a compellingly efficient use of capital — second only to a US Long Treasury exposure.
Figure 2: Relative Performance in Periods of US Equity Market Distress
Quarterly Equity Loss 10% or More
Median Return | -14.3 | 8.1 | 5.1 | 2.9 | 5.7 |
# Negative | 12 | 3 | 2 | 2 | 1 |
Std Dev |
| 10.8 | 3.9 | 6.4 | 5.7 |
| S&P 500 (%) | US Long Treasury (%) | US Treasury (%) | Global Treasury Unhedged (%) | Gold (%) |
|---|---|---|---|---|---|
Dec '87 | -22.5 | 9.4 | 5.7 | 13.6 | 6.9 |
Dec '08 | -21.9 | 18.7 | 8.8 | 8.6 | 0.2 |
Mar '20 | -19.6 | 20.9 | 8.2 | 1.4 | 4.5 |
Jun '22 | -17.4 | -11.9 | -3.8 | -8.9 | -6.9 |
Sep '02 | -15.5 | 12.1 | 7.4 | 3.9 | 3.1 |
Sep '01 | -14.8 | 6.7 | 5.5 | 6.7 | 8.8 |
Sep '11 | -13.9 | 24.7 | 6.5 | 2.2 | 7.8 |
Dec '18 | -13.8 | 4.2 | 2.6 | 2.4 | 7.6 |
Sep '90 | -13.6 | -2.2 | 0.8 | 3.4 | 14.7 |
Jun '02 | -13.4 | 6.0 | 4.5 | 11.7 | 3.5 |
Jun '10 | -11.7 | 12.2 | 4.7 | 0.7 | 12.6 |
Mar '09 | -11.0 | -5.2 | -1.3 | -5.0 | 4.2 |
Source: Bloomberg Finance L.P., as of June 30, 2025. Quarterly returns in USD terms from December 1984 to June 2025. Past performance is not a reliable indicator of future performance. Index returns are unmanaged and do not reflect the deduction of any fees or expenses. Index returns reflect all items of income, gain and loss and the reinvestment of dividends and other income as applicable.
There are few perfect hedges, of course. In the periods covered, there were occasions when longer-dated Treasuries clearly failed as a hedge and posted concurrent losses that amplified negative equity returns. The most conspicuous example of this was in the second quarter of 2022 when US Long Treasuries delivered double-digit losses. Arguably, much of this was attributable to the extremely low yield environment around that time that made future losses on bonds almost inevitable. Gold also failed to provide protection at this time: it’s a salient reminder that cross-asset correlations can shift dramatically at times, not just for overpriced bonds but for other risk-mitigating assets too.
Assessing the current market set-up
Unsustainably large deficits remain a risk for US Treasuries, especially at longer maturities. Nevertheless, US (and other) sovereign yields at current levels offer considerably better return-risk prospects than a few years ago — so, despite the risks, it’s worth noting the favorable aspects of today’s market. At present yields, the long-term return prospects have improved markedly while breakeven (yield/duration) levels have rebounded to their best in almost 15 years.
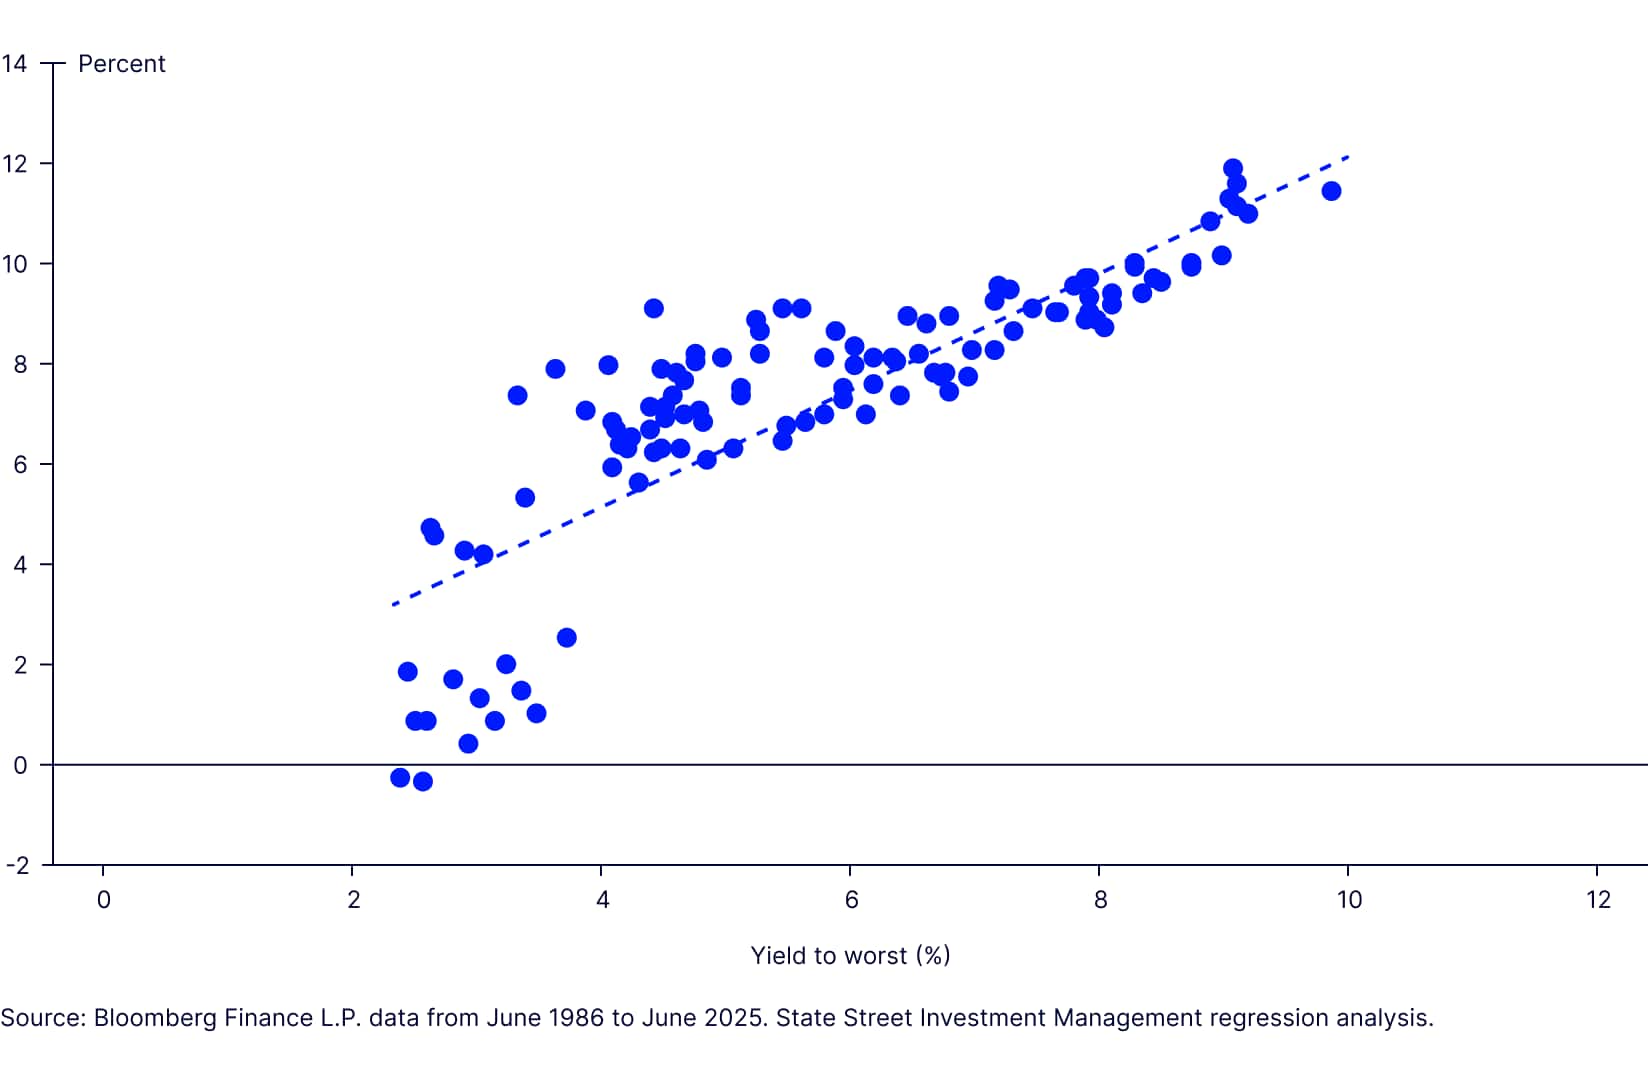
There is a strong and intuitive relationship between yield level and the subsequent return in advanced economy sovereign debt. In the same way that the low yields in 2021 made losses highly likely, today’s yield levels (assuming that historic relations hold firm) point to a strong likelihood of solid gains for both US Treasury and Long US Treasury investors over a medium-to-long-term horizon. The scatter plot in Figure 3 presents the historic relationship since the mid-1980s — it’s clear that higher yields are predominantly associated with higher subsequent returns and vice versa. The relationship is generally a strong one, with a coefficient of determination of 0.7, although the outcomes become less reliable at yields below 4% with a wider dispersion of returns than the regression line would suggest. The encouraging news for investors is that the US Long Treasury index yield of 4.8% (as of 30 June 2025) would imply a future return of ca. 6% per annum. A similar analysis for the broader US Treasury index indicates a potential return of 4.5% p.a. given the current yield of 4.0%. The historic interplay tells us that longer-dated Treasuries offer additional reward at today’s yields relative to the broad market.
Figure 3: Yield and Subsequent 10-year Returns (p.a.)
The other notable point is the change in duration of the 10+ year benchmark. Some of this is due to composition/issuance but the general upward move in yields has allowed the modified duration to fall back meaningfully in the last few years — from a record high of almost 18 years in 2020 to just under 14 years at the end of June 2025. Shorter duration and higher yields translate into a much-improved breakeven setup for investors in US Long Treasuries; at 0.35 the breakeven is at levels last seen in 2010.
Modeling outcomes in a changing fiscal landscape
While the present yield, duration, and breakeven setup presents a favorable and incontestable reality, some investors may believe that past regimes do not hold the same explanatory power over future returns that they once did. This is understandable given that the US fiscal position looks and feels like new territory for Treasury investors. To round out this article, we take a look at some future state scenarios.
In the table below, we present the outcomes of horizon analysis for the US Treasury and the US Long Treasury indexes.
Modelled Return by Horizon and Yield Change (%, p.a.) | |||||
| Yield Change | ||||
None | None | +100 bps | +200 bps | +200 bps | |
Horizon | 3-year | 5-year | 3-year | 3-year | 5-year |
|---|---|---|---|---|---|
US Treasury Index | 4.36% | 4.28% | 3.24% | 2.24% | 3.87% |
US Long Treasury Index | 5.19% | 5.12% | 1.51% | -1.77% | 1.76% |
Source: Bloomberg Finance L.P. and State Street Investment Management for projected returns and horizon inputs, respectively. Returns are estimated using a parallel shift in the US Treasury yield curve by the respective "yield change". In the base case where no change in yield is modelled, we assume that maturing short-dated bonds are replaced with bonds that capture the same yield as the existing 2-year note and those new bonds do not capture any rolldown. Under the shock scenarios, yields are shocked on day 1 and we assume the post-shock yield is captured over the remaining horizon. In these shock cases, we assume no rolldown from the shocked yield levels.
To widen the usefulness of the analysis output, we modelled several parallel shifts in the yield curve over time, while making no assumptions about its future shape. The impact of instant shocks was applied across the curve with yields remaining at those new levels for the remainder of the investment horizon. This scenario produces a more favorable outcome than a shock towards the end of the investment horizon, but we believe it more accurately reflects investors’ concerns that a stress event could happen sooner rather than later in an investment period. Intuitively, when yields are unchanged (apart from rolldown) longer-dated bonds provide greater returns, albeit with the downside risk that the longer duration can start to detract meaningfully from returns at near- and intermediate-term horizons as yields rise. Even the all-maturity index experiences a significant drop-off in return over three years on an instant +200 basis point shock, while its 10+ year counterpart would post outright negative returns per annum in this outcome.
The above scenario is merely illustrative. Ultimately, clients need to consider the appropriate magnitude of a yield shock, the suitable measurement horizon and the probability to assign to individual scenarios.
The bottom line
Incorporating longer-dated US Treasuries into multi-asset portfolios presents a nuanced trade-off between enhanced risk mitigation and heightened sensitivity to yield shocks. Historically, these instruments have delivered superior downside protection during periods of equity market stress, offering more efficient capital deployment compared to broader Treasury benchmarks and alternative hedges like gold. Moreover, recent shifts in yield and duration dynamics have further improved their risk-return profile.
Nonetheless, structural fiscal concerns and evolving cross-asset correlations warrant careful scenario analysis. With the White House more actively involved in the composition of the Federal Reserve’s Board of Governors, perceptions of waning independence can also impact the Treasury market, and not just the longer end (see Should you be worried about Fed independence?). Investors should weigh these factors thoughtfully when considering strategic allocations to longer-dated Treasuries as part of a resilient portfolio framework.