Then and Now: Comparing Recent Bank Unrest to the 1980s S&L Crisis
Many market participants are digging into the past to make sense of the recent turbulence in US banking. The first stop is often the series of banking crises of the 1980s, another period when the Federal Reserve (Fed) was combating inflation by raising rates and the yield curve was deeply inverted (though in recent weeks, recalibration of the Fed’s path has prompted significant steepening). In our view, the failure of Silicon Valley Bank (SVB) and the broader regional bank tumult exhibit greater resemblance to one particular crisis of the 1980s: the savings and loan (S&L) crisis. Meanwhile, the collapse of Credit Suisse Group could make an apt comparison with the commercial bank failures of the 1980s.
SVB, SBNY and the S&L Crisis
In the 1980s, sharp interest rate hikes proved punishing blows to thrift bank balance sheets, which were heavy on long-duration, fixed-rate assets, especially commercial real estate (CRE) loans. Some of the details of the 1980s S&L meltdown may sound familiar. Commonalities between that crisis and the recent closures of SVB and Signature Bank (SBNY) include:
Asset/liability mismatch
From 1980 to 1990, the proportion of CRE loans in S&L portfolios nearly doubled to 12%.1 These long-term assets had a significant interest-rate mismatch with the banks’ shorter-term liabilities (deposits), as competitive pressures and inflation incited banks to raise the deposit rates offered.
Asset values plunged when interest rates soared under then-Fed Chairman Paul A. Volcker’s efforts to curb inflation. Rates rose from 14% to 18% in one year (1980).2 On top of this, as rates rose, customers sought higher interest rates outside of the Federal Reserve-capped deposit rates, exacerbating thrift banks’ net income losses. The US General Accounting Office estimated a $160 billion final cost to resolve failed S&Ls.3
Today, the pace of interest rate increases throughout 2022 and 2023 is the fastest we have seen since the 1980s. Since March 2022, interest rates have surged to 4.75% from 0.25%. Regional banks are generally concentrated in CRE, small business loans and construction loans.4 SVB held 92% of its fixed-income portfolio in US Treasurys and GSEs, and its average fixed-income portfolio duration was 5.6 years.5 As a result, SVB experienced losses on its asset portfolio as rates rose. Meanwhile, deposit rates were shorter duration, leading to an asset-liability mismatch and significant net income compression.
Notably, the 2s10s Treasury curve spread widened to 97 bps in October 1981, as the curve inverted due to the impacts of monetary policy. The 2s10s handily exceeded that in mid-March, reaching over 100bps. In both periods, the inverted curves exacerbated the need for banks to increase their deposit rates, exacerbating the contractions in net interest margin (Figure 1).6
Soaring deposit levels
During the 1980s crisis, S&L growth was fueled by an influx of deposits into institutions willing to pay elevated rates to depositors. In 1983 and 1984, more than $120 billion in net new money poured into S&Ls.7
In recent years, deposits have also risen rapidly, for several reasons. First, COVID-19 pandemic-related government stimulus payments to individuals landed in deposit accounts; second, post-GFC regulations encouraged banks to hold more lower-risk sources of funding, such as deposits; and third, individual savings rates increased.
At SVB, the balance sheet exploded well above nominal GDP over an extended period. Over the span of six quarters, the bank went from $71 billion in assets to a peak of $220 billion.8 Post-COVID, its assets grew at 10 times nominal GDP versus a peer median of 1.2 times. Looking at other failed banks, SBNY grew six times nominal GDP, while Silvergate Capital grew twenty-one times.9
Lack of diversification in assets
Silvergate had over 50% of its loan book in cryptocurrency,10 While SVB had 56% of its total loan mix in venture capital and private equity.11 Signature Bank has 45% in mortgage loans and 37% in lines of credit. Similarly, in the 1980s, many regional bank asset portfolios lacked significant diversification, and net loan charge-offs were low; 0.27% for SBNY, versus 0.1% for regional banks in the 1980s.
Element of surprise
The S&L crisis was hardly a surprise. The vast number of actual and threatened insolvencies of savings and loan associations in the early 1980s was predictable because of the interest-rate mismatch of the institutions’ balance sheets.12 For CRE, the boom was due to demand and speculative from inflation, and the bust happened in the late 1980s, and it appeared more as a boom-bust cycle rather than a sudden surprise. Meanwhile, the fall of SVB was a surprise because the bank was growing in assets and was holding assets with low charge-offs.
Credit Suisse and the 1980s Commercial Bank Failures
The 1980s crises also included a slew of large commercial bank failures, such as the 1988 demise of First Republic Bank Corp., which saw forty bank subsidiaries closed and sold to NCNB Corporation. The insured subsidiary payouts of First Republic Bank Corp. cost the FDIC $4 billion.13 The commercial bank failures stemmed from more factors than the asset-liability mismatch; rather, the banking crisis of the 1980s included economic, financial, and regulatory factors, plus “there was no evidence of serious runs or credit-flow disruption at federally insured institutions,” per a study prepared by the FDIC's Division of Research and Statistics.
Credit Suisse, the 167-year-old Swiss banking giant, has faced a wide range of problems in recent years, such as a scandal surrounding spying on former employees; a $5.5 billion loss related to its ties with the Archegos hedge fund; a $10 billion loss ($7.4 billion recovered so far)14 due to its exposure to British supply chain finance firm Greensill Capital; and the loss of capital support from two major shareholders (Harris Associates and Saudi National Bank). Prior to its takeover by Swiss bank UBS, Credit Suisse was facing $10,000 a day in withdrawals. Like the commercial banks of the 1980s, its downfall was not the result of an asset-liability mismatch alone; rather, it was defeated by a long list of challenges.
Broad Changes: The 1980s versus Today
We can also consider how the banking failures of the past month (both the regional and commercial banks) differ from the 1980s crisis. There was rapid growth in the agriculture and energy sectors prior to the banking crisis in 1980s, and the subsequent bust period eventually translated to bank failures. However, today, the rapid growth came from countrywide government stimulus, and the surplus is shown in the banks’ inflated balance sheets. Recent bank failures have less to do with regional boom-bust cycles. They are more like the S&L crisis, in which rising interest rates and risk management played a major part. Having learned from past crises, regulators responded faster and more proactively this time around than they did at the beginning of the 1980s banking crisis.
Today’s Bank Failures Are Not Region Specific
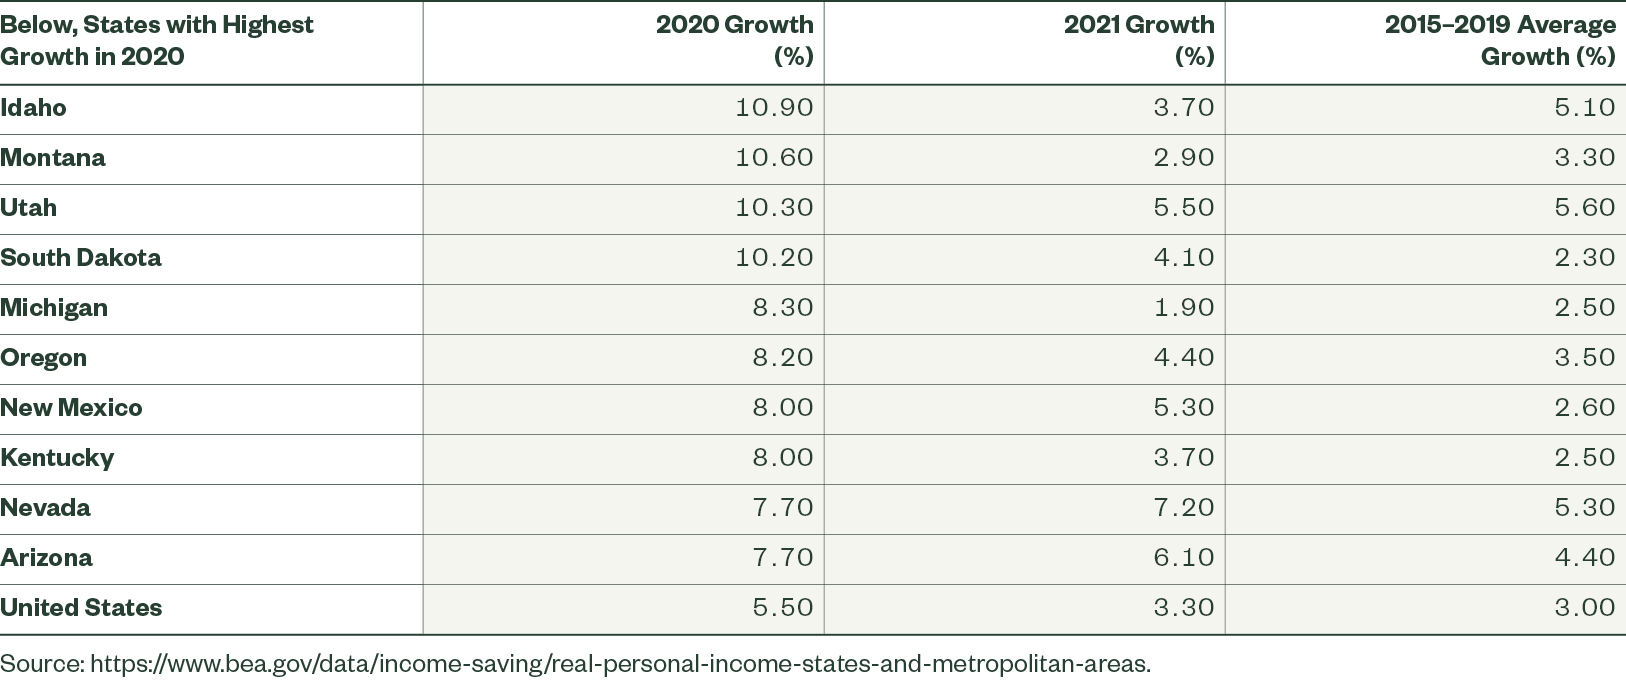
Back then, bank failures were generally associated with regional recessions that had been preceded by rapid regional economic expansions. The FDIC points to “four major regional and sectoral economic recessions” from 1980 to 1994, including a decline in farm prices that hurt banks with hefty agriculture loans; a reduction in oil prices that hit Texas and other energy-producing southwestern states, followed by a “regional boom and bust” in CRE activity; and recessions in northeastern states and California.15 In the bulk of bank failures during this period, most of them occurred in regions experiencing rapid economic expansion first, then a downturn.16 By contrast, today’s domestic economic growth is not heavily concentrated in regions, and while growth in 2020 was higher than historical levels, 2021 growth is decelerating (Figure 2).
Figure 2: Today's Growth is Fairly Even Across Regions
Real Personal Income Growth
The Recent Regulatory Response Was Swifter
In the 1980s, the government’s first response to the banking rout was to deregulate expected S&Ls in hopes that they would grow out of their losses and restructure when interest rates reverted to trend levels. Deregulatory actions included the Depository Institutions Deregulation and Monetary Control Act of 1980 (DIDMCA), which phased out deposit interest-rate ceilings, and the Garn-St Germain Depository Institutions Act of 1982, which broadened the powers of thrift institutions.17 However, the thrift banks simply took on riskier loans, and the thrift and commercial banking problems deepened.
Regulators today acted faster to quell concerns about the health of the banking system. In the US, the Fed unveiled the Bank Term Funding Program, which allows banks to borrow against securities at par. In Switzerland, regulators orchestrated the purchase of Credit Suisse by UBS.
A key takeaway is that the bank regulations post-GFC were reasonably successful in modifying the behavior of officially designated “problem banks” to reduce their prospects of failure or to mitigate the costs to the FDIC if failure occurred. The regulators were less successful in constraining risk taking by still profitable and healthy banks, partly because there are no reliable, generally accepted, forward-looking measures of risk. In our view, bank regulation can limit the scope and cost of bank failures, but is unlikely to prevent failures that have systemic causes.
All Eyes on Bank Deposits
The recent bank failures call attention to the asset-liability mismatches at financial institutions that could spur losses at banks holding a sizable portion of their investments in long-duration, fixed-income assets. In addition, the depositor run on SVB alerted markets to the unwieldy spiral of withdrawals that can result from depositors’ concerns about bank health. Today, total assets of all commercial banks have increased to $22.9 trillion (Figure 3),18 and banks’ need to place these assets into Treasury or Agency securities can exacerbate declines in assets. Withdrawal fears can be compounded by higher rates available outside of deposit accounts (i.e., at money market funds) and the moral hazard that the Fed’s repayment of uninsured depositors may lead to more customers seeking banking relationships based solely on the level of deposit rates. Data shows that anywhere from $0.3 trillion to $4.9 trillion of a bank’s total assets can fail should there be a 50%–100% uninsured depositor run. Fully 2,315 out of 4,844 banks are deemed insolvent if the mark-to-market value of assets is insufficient to cover all non-equity liabilities.19
Conclusion
In sum, the problems endured by regional banks in recent weeks bear resemblance to the S&L crisis of 1980. Current banking pressures are taking place during a similar macro backdrop as the 1980s; back then, the economy was also combating high inflation and inflated growth. Similar issues such as asset/liability mismatch, soaring deposit levels and a lack of diversification in assets can be compared among banks, period to period.
However, it is important to note that the 1980s banking crisis had its roots in regional recessions and weak bank supervision. Today, with the economy slowing and high interest rates challenging the banking sector, regulators are closely monitoring the overall financial stability, and are willing to take prompt and preventative actions.