Support levels in sovereign debt markets
One of the many ramifications from the conflict in the Middle East has been the resurrection of the stagflation narrative. For investors, the question has quickly become one of whether higher yields across sovereign bond markets are a temporary response to the Iran war and associated pickup in inflation or is it evidence that markets are settling into a new regime. The answer is not straightforward, and can differ across markets.
There is an argument to be made that yields have broken out to new levels in some countries, while long-standing technical ranges appear intact in others. Although fundamentals are still the dominant factor in fixed income investing and underpin our broadly constructive view on sovereigns, support and resistance levels are interesting to interrogate, particularly in the context of key levels being threatened.
In the table below, we summarize some key levels for investors to keep a close eye on. A yield above current market pricing offers investors a more attractive entry point, thereby providing a potential support level for the market. A yield below current market pricing may offer investors a more attractive exit point, thereby providing a potential resistance level. We then explore these levels on a market-by-market basis.
Figure 1: Indicative support/resistance levels for major benchmark bonds
| Benchmark | Potential Support | Potential Resistance |
| 10-year US Treasury | 5.0% / 5.25% | 4.00% |
| 30-year US Treasury | 5.25% / 5.5% | 4.00% |
| 10-year JGB | 2.5% / 3.0% | 2.00% |
| 10-year Bund | 3.00% | N/A |
| 10-year Gilt | 5.0% / 5.25% | N/A |
| 30-year Gilt | 6.00% | 5.00% |
| 10-year Australian Gov’t | 5.00% | 4.00% |
Source: Bloomberg Finance L.P., State Street Investment Management as of May 21, 2026.
UK Gilts: Test case for higher yields, or an outlier?
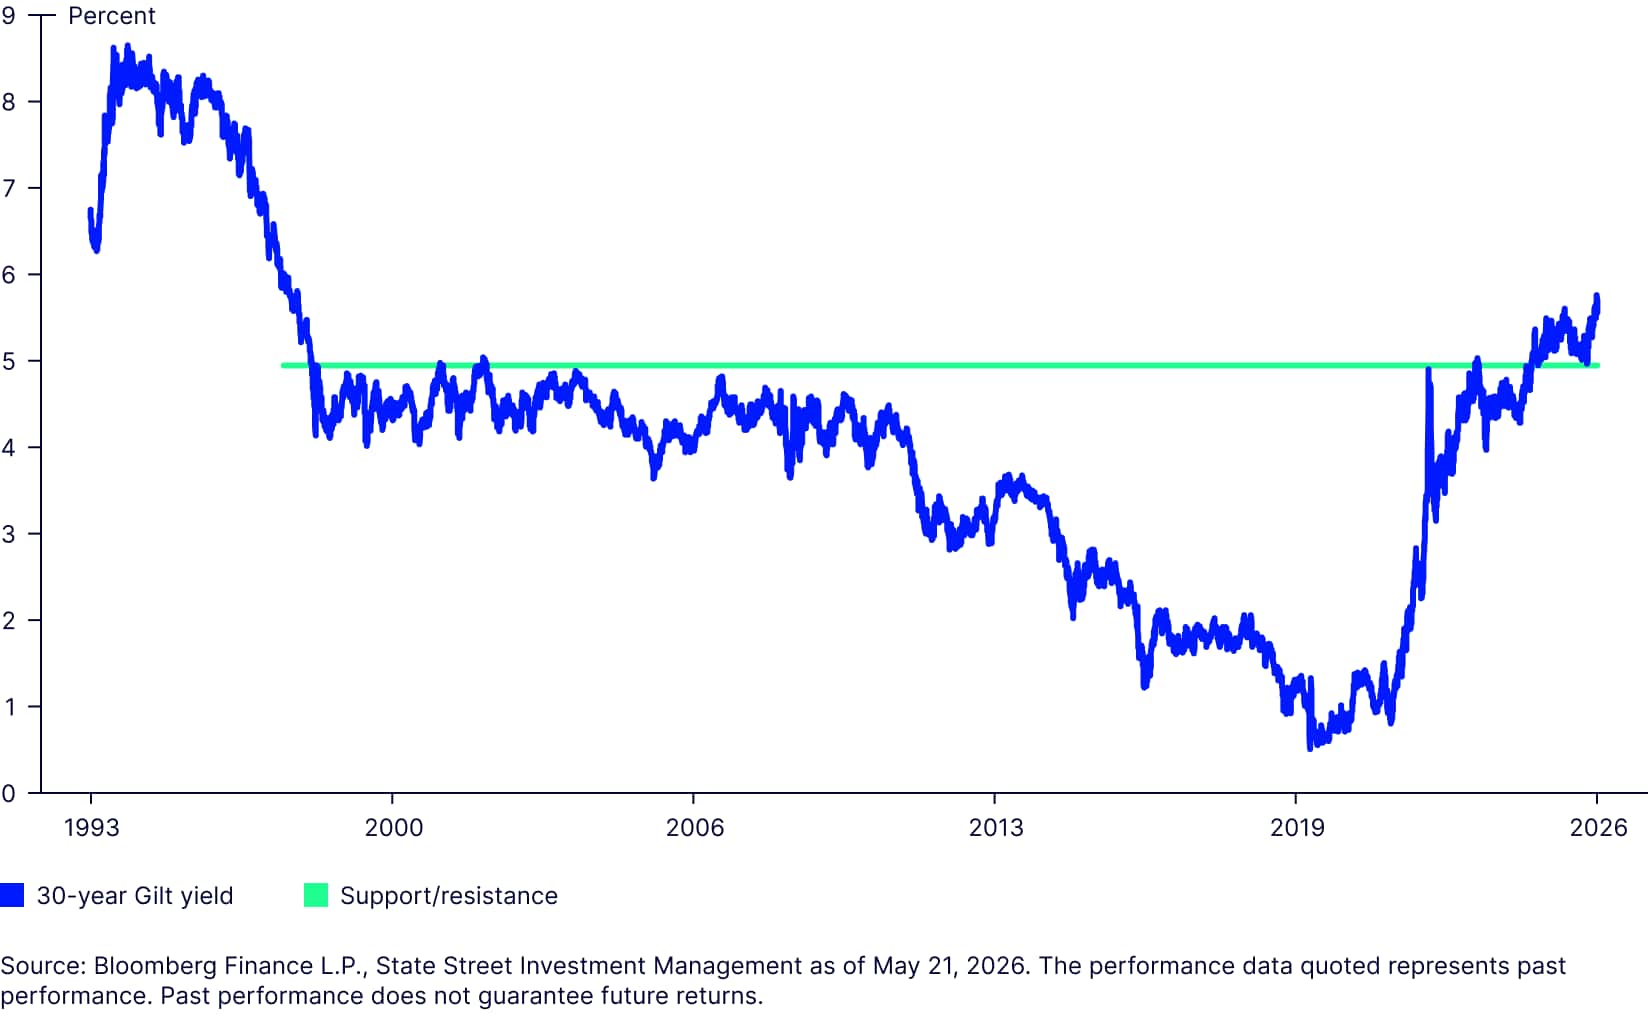
Before the most recent deterioration of the global geopolitical landscape, yields on long-dated Gilts appeared to have already reset to higher levels. As illustrated in Figure 1, there’s a yield level around 5% that has long been a major line in the fiscal sand for 30-year Gilt investors. From the late 1990s to the eve of the Global Financial Crisis in 2008, that 5% level was tested several times and held each time to establish itself as something of a ceiling1 on 30-year yields. After some time in chart wilderness, the 5% cap made a dramatic return: Prime Minister Liz Truss’s infamous 2022 mini-budget was a perfect storm to test this historic key level. It was subsequently tested intermittently before finally being breached amid a broad bond selloff in major developed markets towards the end of 2024. Once breached, a well-established ceiling can often become a new floor, i.e. what was previously an attractive entry point can become a profitable exit level.
It’s too early to be definitive, but we may be entering a phase where 5% is the lowest acceptable yield for investors in 30-year Gilts. Domestic growth, inflation, and the supply-demand balance will determine where that floor ultimately settles. Moreover, Gilts do not trade in isolation, with sovereign yields across other advanced countries influencing movements—so in assessing the prospect for long-term UK yields, it’s wise to also keep an eye on the UK’s G7 peers as these dynamics play out.
Figure 2: A new floor in 30-year Gilt yields?
JGB yields set new floor?
The UK experience indicates that the market may have already repriced to a new level, but it is not alone. The drivers of Japanese government bond (JGB) yields are perhaps more distinct than those underpinning moves in the UK. The commanding majority recently secured by Prime Minister Takaichi’s LDP-led coalition provides the latitude to pursue a more expansionary ("responsible yet aggressive") fiscal policy approach, something that JGBs have been gradually pricing in. The election outcome may well add impetus and conviction to the trade, as may the ongoing tightening of monetary policy by the Bank of Japan.
This evolving backdrop has resulted in a conspicuous breakout of yields to multi-decade highs across several points on the Japanese sovereign curve. Even more so than long-dated Gilts, the benchmark 10-year JGB has moved decisively out of a regime long-defined by a 2% ceiling.
Figure 3: 10-year JGB yields stretch above 2%
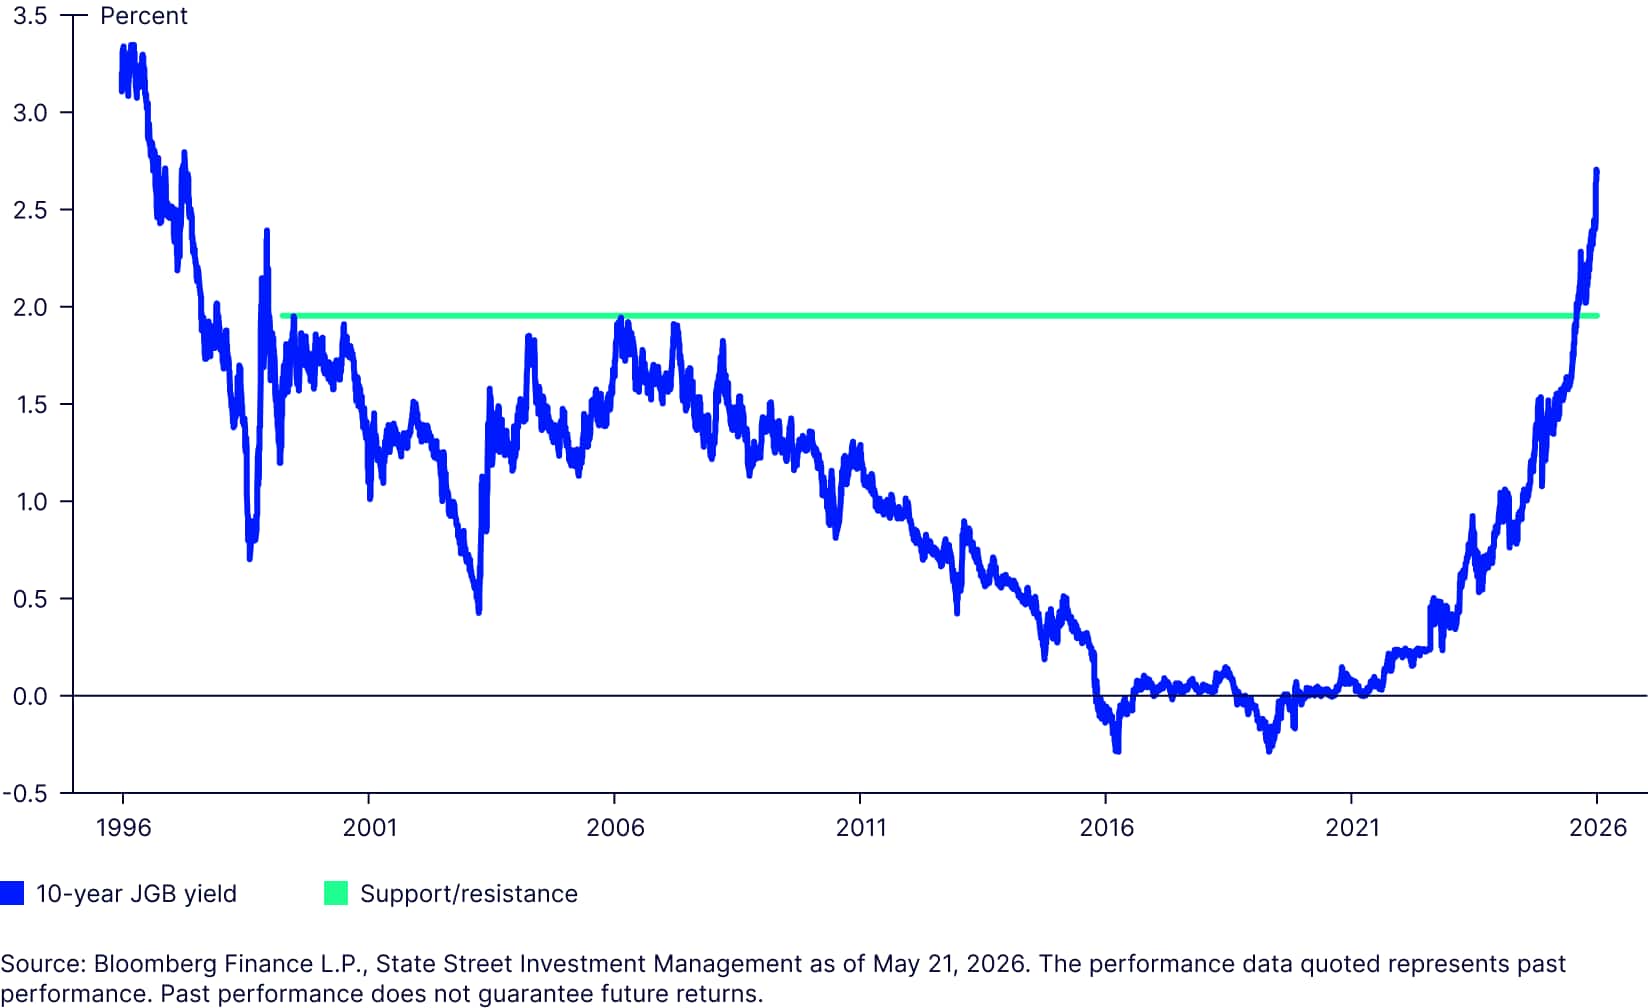
The previous buying level now looks more like a take-profit trigger.
Above 2%, a clearly defined support level is difficult to identify. There was some congestion around the 2.5% level in late 1996 and early 1997, and then again around the early 1999 cycle high, making this a plausible interim support zone. Importantly, real money domestic investors—particularly banks—have increasingly signaled an appetite to add on dips in the 2.5–3% range, which could help build a floor around this level. Beyond that zone, the next meaningful technical support likely sits closer to 3.5%.
US Treasuries: The global anchor
None of these markets trade in a vacuum—moves in longer-dated yields tend to be quite synchronized, since arbitrage opportunities help keep yields and spreads in check for a given set of fundamentals. As the largest and most liquid bond market, the US Treasury market serves as a global reference and the linchpin for global yields. The dominance of the US market and synchronized movements may make chart levels in one market redundant in the short term or catapult the yield of another market beyond a support level (as may have been the case with long-dated Gilts in late 2024).
In that respect, it is notable that the 30-year US Treasury yield has remained within its current regime. Despite well-aired concerns around large US deficits, it seems the improved supply dynamic has alleviated the upward pressure for now. The levels are less clearly defined in the chart below. Nonetheless, there does seem to be a degree of established support between 5.25% and 5.5% that was tested and held from 2003 to 2007. Markets tend to have a penchant for round numbers—25 and 50 basis points are round numbers in coupon-clipping territory—so that 5.5% level may develop magnetic qualities for some in the coming quarters.
Figure 4: US 30-year Treasury yield. A stable anchor for all?

While the charts shown in Figure 1 and Figure 2 indicate breakout moves in the UK Gilt and JGB markets, the US Treasury market has yet to test key levels on the upside (Figure 3).
Australia: Leading the way down under
With the specter of inflation reemerging, yield curves have generally bear-flattened across many sovereign markets. Australia may serve as an example for what happens when central banks stop cutting rates and start hiking—after all, the Reserve Bank of Australia (RBA) started raising rates before the Iran conflict even began. The market reaction to the policy shift is instructive, if other monetary authorities follow the same path.
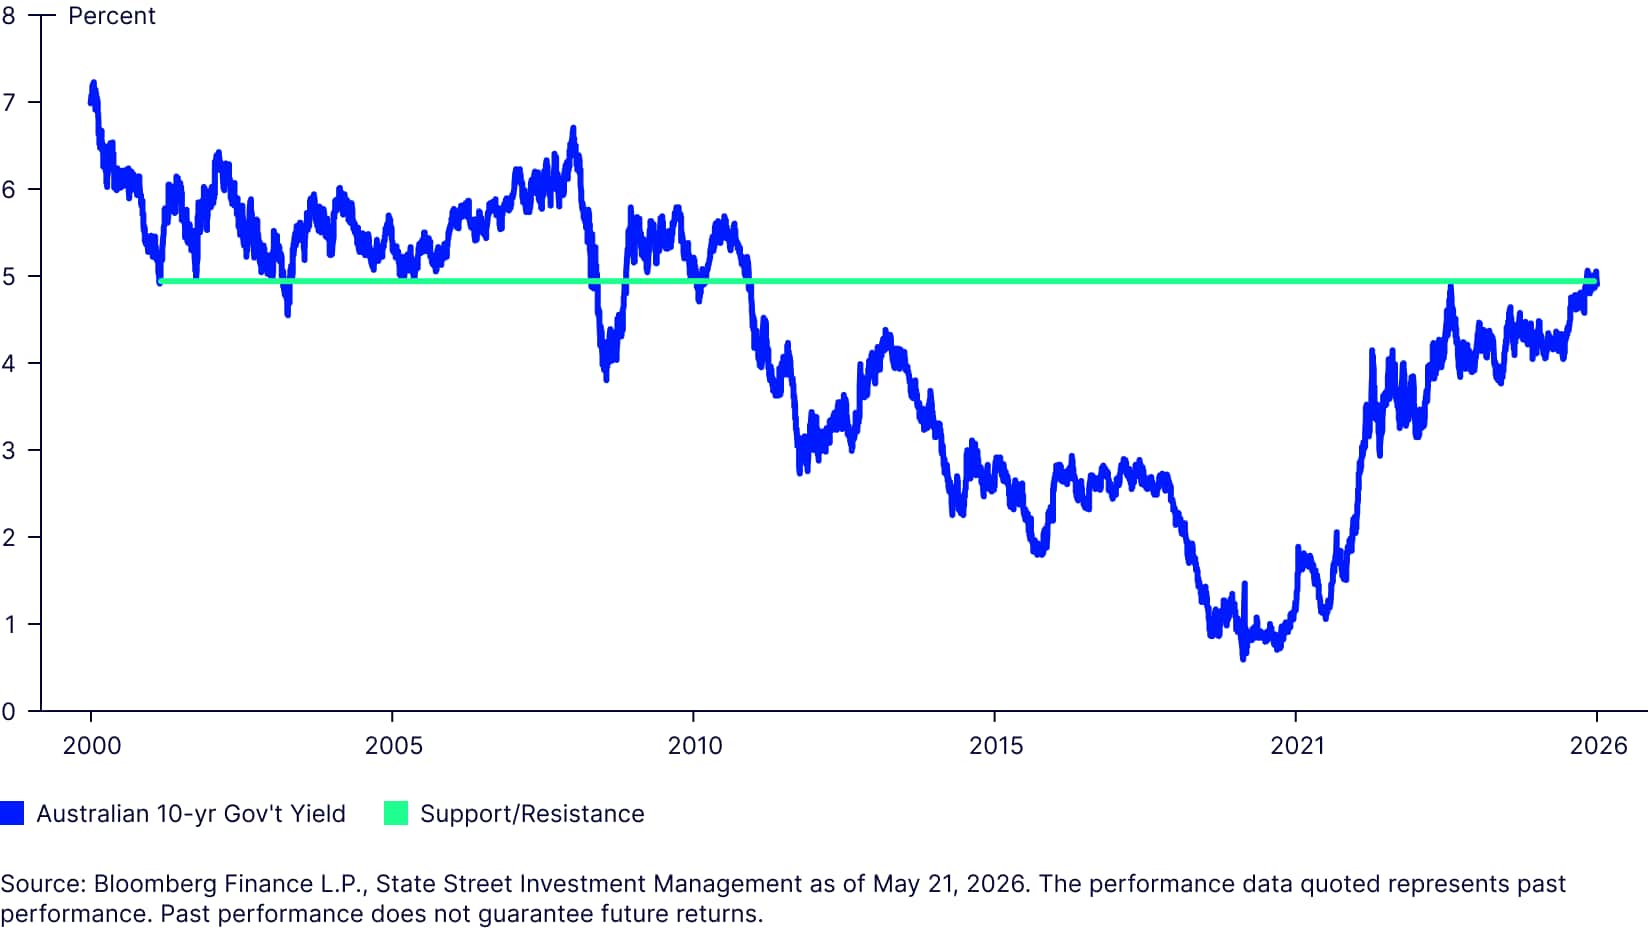
The more policy-sensitive points on the Australian curve appear to have made decisive breaks above the cycle high seen in late 2023. At that time, two- and five-year yields were capped at approximately 4.5%, but the RBA’s policy turn has triggered a move beyond that level for both the two-year bond and five-year bond. The picture is much less clear for the 10-year bond yield. Having topped 5% for a brief period, it is still hovering around that level. The Australian government bond market does not have the same tried and tested floor and ceiling levels seen elsewhere, but the 5% marker seems important given it marked the cycle high in 2023 and repeatedly acted as a floor in the early 2000s.
Figure 5: Australia 5% yield level worth monitoring
Eurozone bonds: Back to Bunds
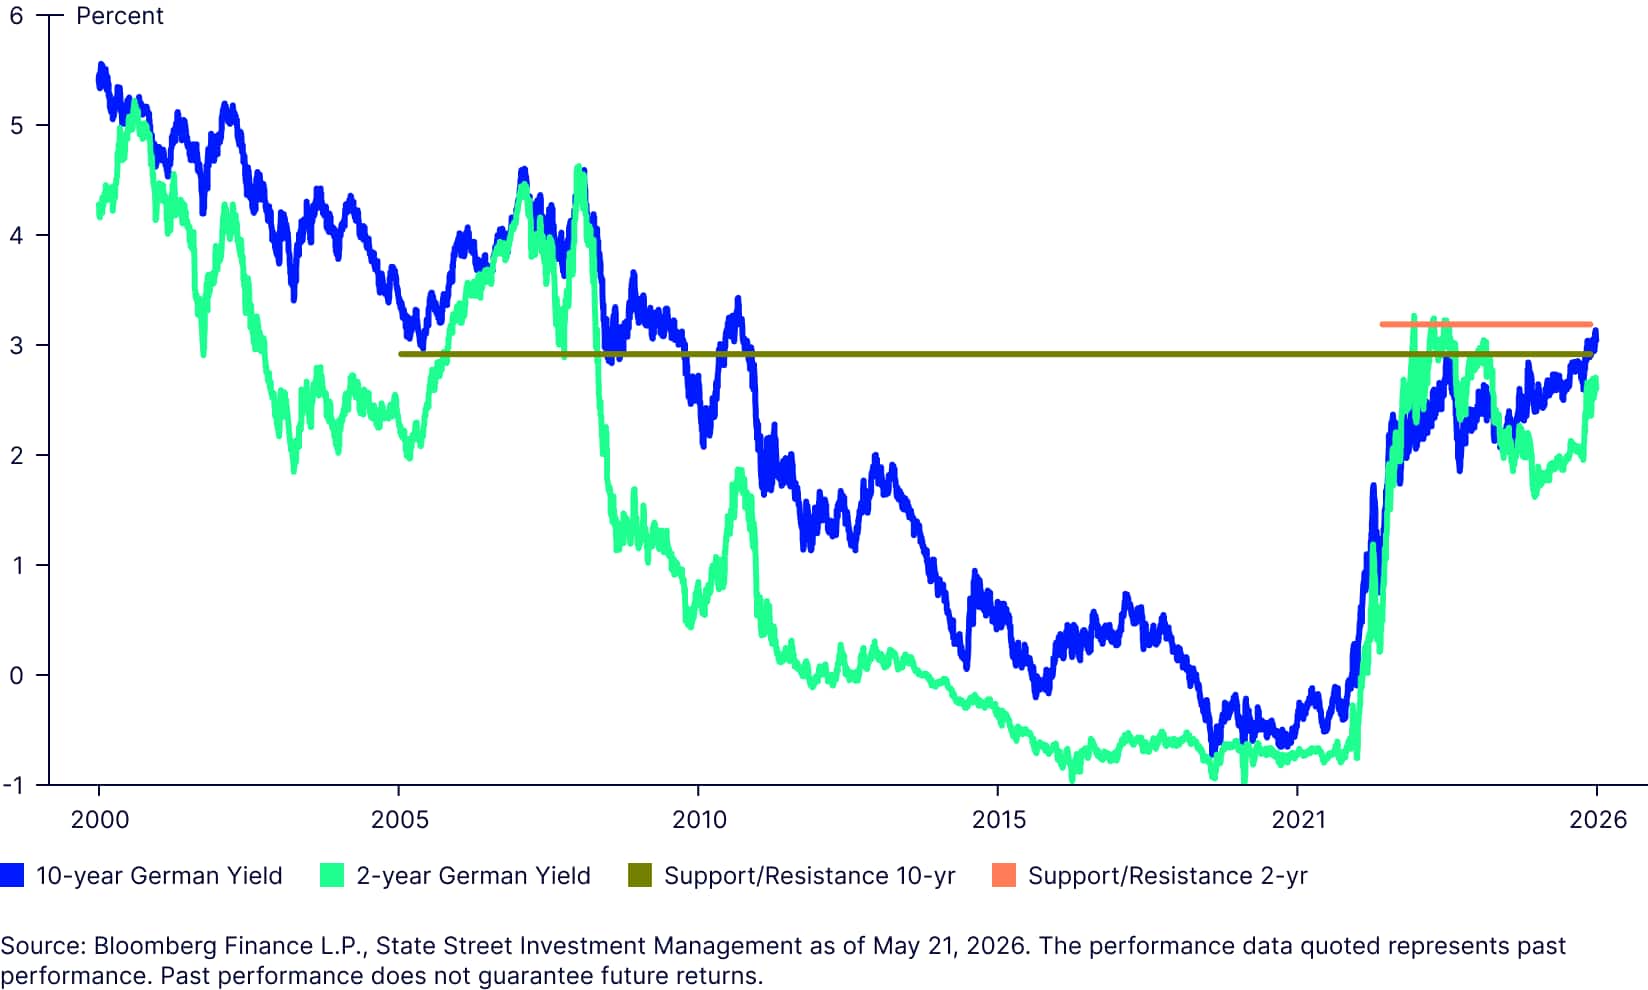
Europe seems to sit somewhere between the US and UK/Japan in terms of curve repricing. Some longer-dated German government bonds have once again been flirting with key historic levels. The 10-year Bund is a prime example: a yield of around 3.0% was considered to be the floor in late 2005 and again in late 2008 and early 2009. Having rebounded from the lows of the Eurozone Debt Crisis and the Covid period, the 3% level was reinforced as key when it delineated the cycle high in 2023—it has oscillated around this level in recent times.
Coming down the maturity spectrum, the five-year yield is also closing in on a critical level around 2.80% to 2.90%, which had provided support in the immediate aftermath of the GFC and also marked the cycle high in 2023. Like the 10-year Bund, this is a critical level which, if conclusively breached, could meaningfully change return prospects. Reassuringly, the short-end of the German curve is not threatening any significant historic levels. Despite a considerable move higher since end-February, two-year yields are still comfortably below the last cycle high just above 3.25%, an important support level that was tested a number of times in 2023.
Figure 6: German Bund yields
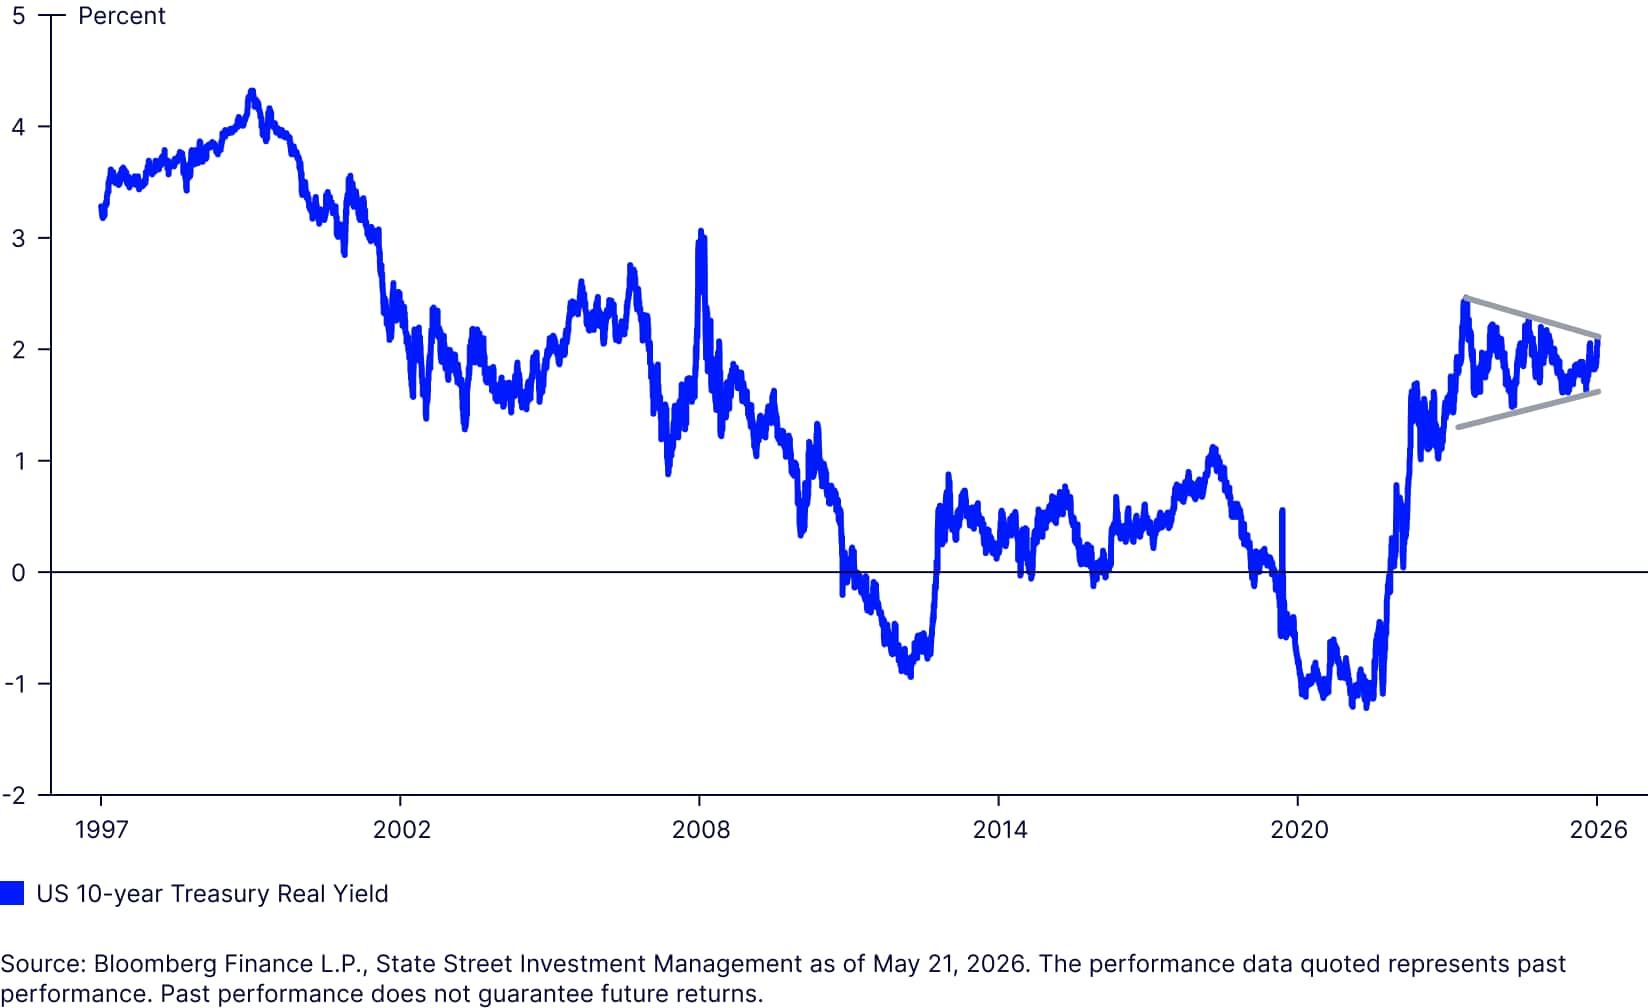
TIPs: Poised for a breakout
We close with a look at inflation-linked bonds. Market structure, relatively limited issuance, and lower liquidity present some challenges to what can be reasonably inferred from inflation-protected securities. Here we look at the US 10-year Treasury Inflation-Protected Security (TIPS). Like its nominal counterpart, there are no major technical levels nearby that might point to a breach in the near term. Tentatively, we might say that 3.0% formed a floor in late 2001/mid-2002 and then acted as a ceiling during the GFC. That’s a bit of a guesstimate, given it hasn’t been a frequently visited level and trading in TIPS hit significant liquidity challenges through the GFC. Interestingly, just like the nominal 10-year Treasury, TIPS have been forming a symmetrical triangle pattern since mid-2023, a development that often ends in a sharp breakout in one direction or the other.
Figure 7: Triangle pattern has formed in US 10-year TIPS
Geopolitics a major factor in what comes next
In our Global Market Outlook 2026, we noted moderately favorable prospects for sovereign debt this year. The Iran war has clearly increased downside risks and much depends on whether a durable ceasefire can be secured, a development that should allow central banks to step back from a more hawkish posture, thus helping yields move back toward pre-war levels. Escalating conflict and/or ongoing energy blockages reinforce stagflation risk. The scale and duration of these, among other, factors will determine inflation and stagnation dynamics—with consequences for yield levels and curve shape. TIPS would be preferred to nominals in such a scenario. That would also mean that some of the technical levels outlined above are tested and possibly reinforced as new floors for yields.
However, a decisive breach is needed for investors to reconsider their current positioning. Such a breach has been evident in the 10-year JGB yield: 2.5% and 3% now look like levels where domestic investors potentially re-emerge as buyers. But even with a (fragile) ceasefire in place, it’s notable that 10-year benchmarks in both Germany and Australia have retested the cycle highs of 2023 in May.
This paper is part of a broader Income, Engineered for Outcomes series.
➡ Visit the Fixed Income Hub to continue the series