Q3 2025 Systematic High Quality Corporate commentary
- Our Systematic US High Quality Corporate Bond strategies continue to perform well through different market environments, delivering competitive and consistent alpha, both absolute (19bps for Intermediate, 37bps for Long in Q3) and risk-adjusted.
- Relative to active peers, our live SAFI strategies have generated top-decile information ratios with attractive downside protection characteristics.
- Factor contribution to outperformance is robust and diversified, with value leading the way and momentum contributing in the Intermediate strategy.
SAFI generates strong, consistent performance by having diversified factor exposure
Our Systematic Active Fixed Income (SAFI) strategies continue to deliver strong, consistent alpha. In the third quarter, our two live Systematic US High Quality Corporate Bond strategies – Intermediate 1-10 year and Long 10+ year – delivered +19 and +37bps of alpha respectively, gross of fees. Since conversion to the SAFI investment process at the end of 2023, the two strategies have delivered annualized alpha of +84bps and +107bps, respectively, over their A or better corporate benchmarks.
Figure 1: SAFI performance through September 2025
| Intermediate (1-10Yr) Portfolio | Long (10+ Yr) Portfolio | |||||||
| QTR (%) | YTD (%) | 1 Year (%) | Since SAFI Inception (%)* | QTR (%) | YTD (%) | 1 Year (%) | Since SAFI Inception (%)* | |
| Systematic US High Quality Corporate Bond (Gross) | 2.1 | 6.88 | 5.55 | 6.01 | 4.03 | 8.03 | 0.99 | 3.03 |
| Benchmark*** | 1.92 | 6.41 | 4.77 | 5.16 | 3.65 | 7.46 | 0.03 | 1.96 |
| Excess Return (Gross)* | 0.19 | 0.47 | 0.78 | 0.84 | 0.37 | 0.58 | 0.96 | 1.07 |
| Systematic US High Quality Corporate Bond (Net) | 2.1 | 6.87 | 5.54 | 5.99 | 4.02 | 8.02 | 0.98 | 3.02 |
| Benchmark*** | 1.92 | 6.41 | 74.77 | 5.16 | 3.65 | 7.46 | 0.03 | 1.96 |
| Excess Return (Net)** | 0.18 | 0.46 | 0.76 | 0.83 | 0.37 | 0.57 | 0.95 | 1.06 |
| Tracking Error Volatility | 0.22 | 0.29 | 0.4 | 0.41 | ||||
| Information Ratio | 3.57 | 2.89 | 2.4 | 2.63 | ||||
Source: State Street Investment Management. As of September 30, 2025. Inception date for Intermediate: 5/1/2010. Inception date for Long: Inception date: 5/20/2011. * Since-inception performance reflects conversion to our Systematic Active Fixed Income (SAFI) investment process effective December 31, 2023. “Other” comprises pricing difference, implied volatility, management fee, and interest rate derivative basis. Past performance is not a reliable indicator of future performance. Index returns are unmanaged and do not reflect the deduction of any fees or expenses. Index returns reflect all items of income, gain and loss and the reinvestment of dividends and other income as applicable.
Returns greater than one year are annualized. Past performance is not a reliable indicator of future performance.
Current performance may differ from the performance shown. * Gross performance figures are provided gross of fees and expenses other than actual trading fees and expenses, and reflect all items of income, gain, and loss. ** Net performance figures (i) are provided net of actual trading, audit, custody, administrative and legal fees and expenses; (ii) beginning on September 30, 2014, adjusted quarterly to reflect the highest investment management fee on the actual fee schedule, inclusive of incentive fee, if any, of any account within the Composite ("Management Fee") at the relevant time; and (iii) reflect all items of income, gain and loss. ***Index returns reflect capital gains and losses, income, and the reinvestment of dividends. Index returns are unmanaged and do not reflect the deduction of any fees or expenses. It is not possible to invest directly in an index.
Performance returns are calculated in US dollars. Calculation for value added returns may show rounding differences. For Composite data see endnotes.
Consistent alpha generation through a transparent factor-based, risk-controlled process
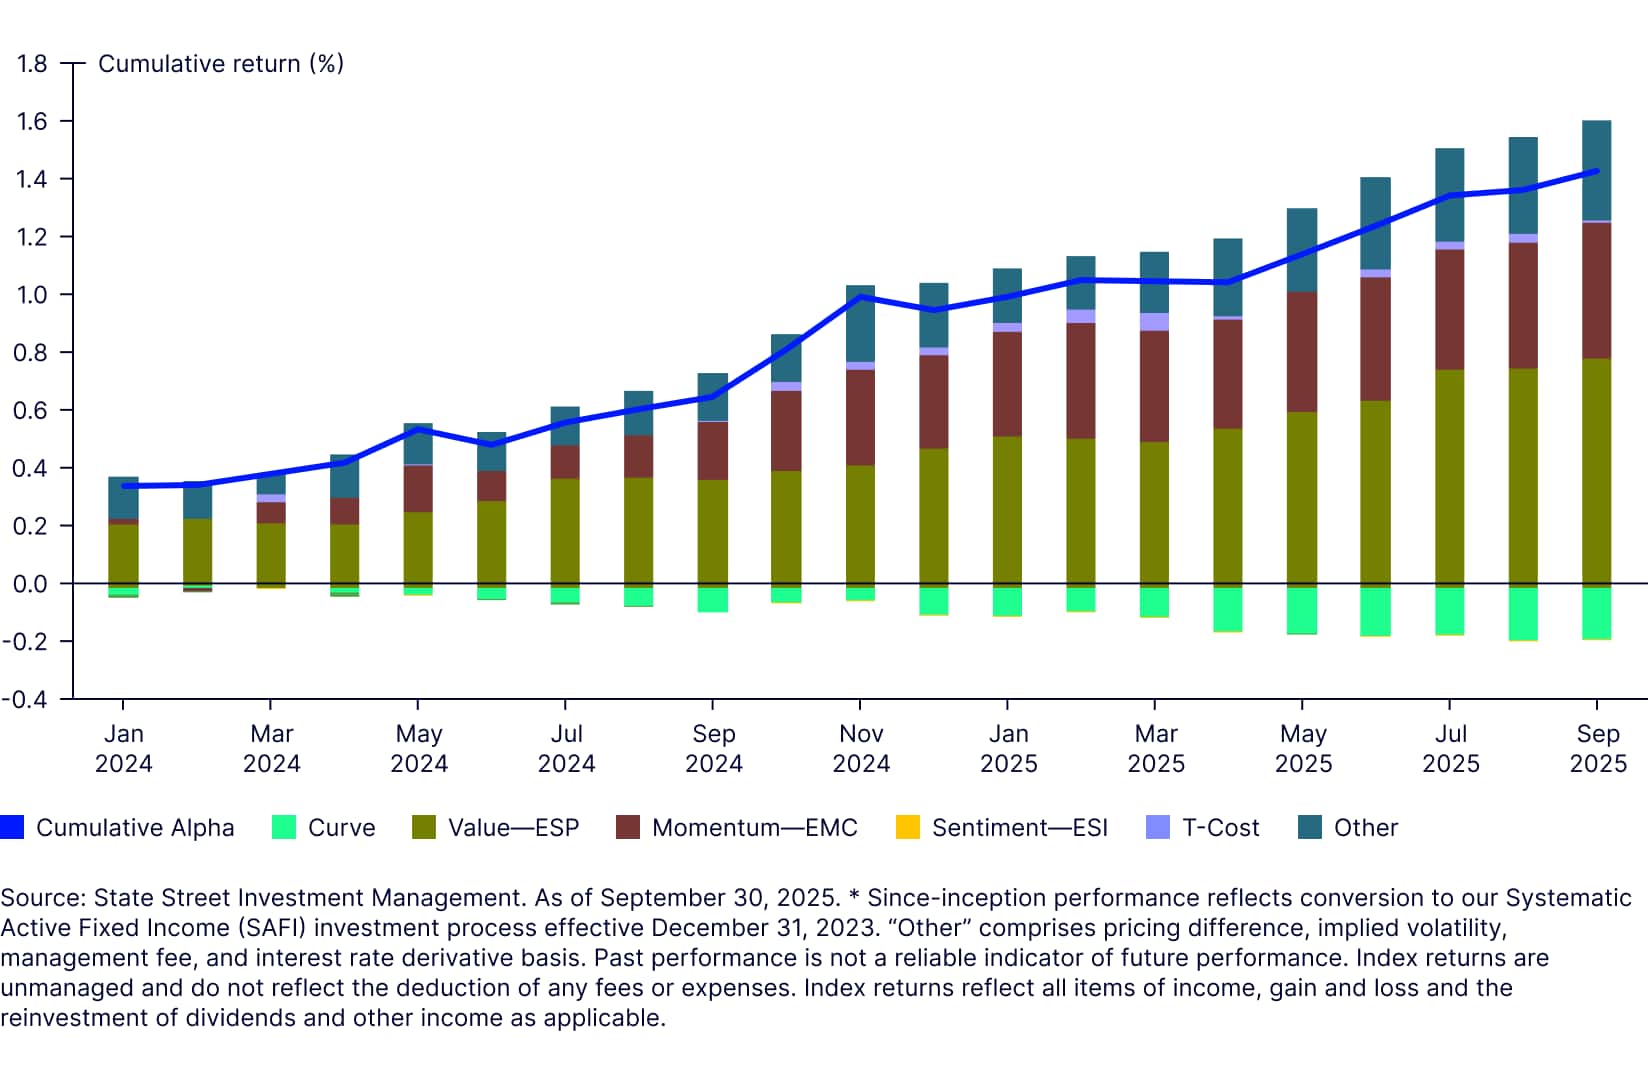
Factor contributions to performance have been robust for both value and momentum in the Intermediate strategy, while performance in the Long strategy has been more dominated by value.
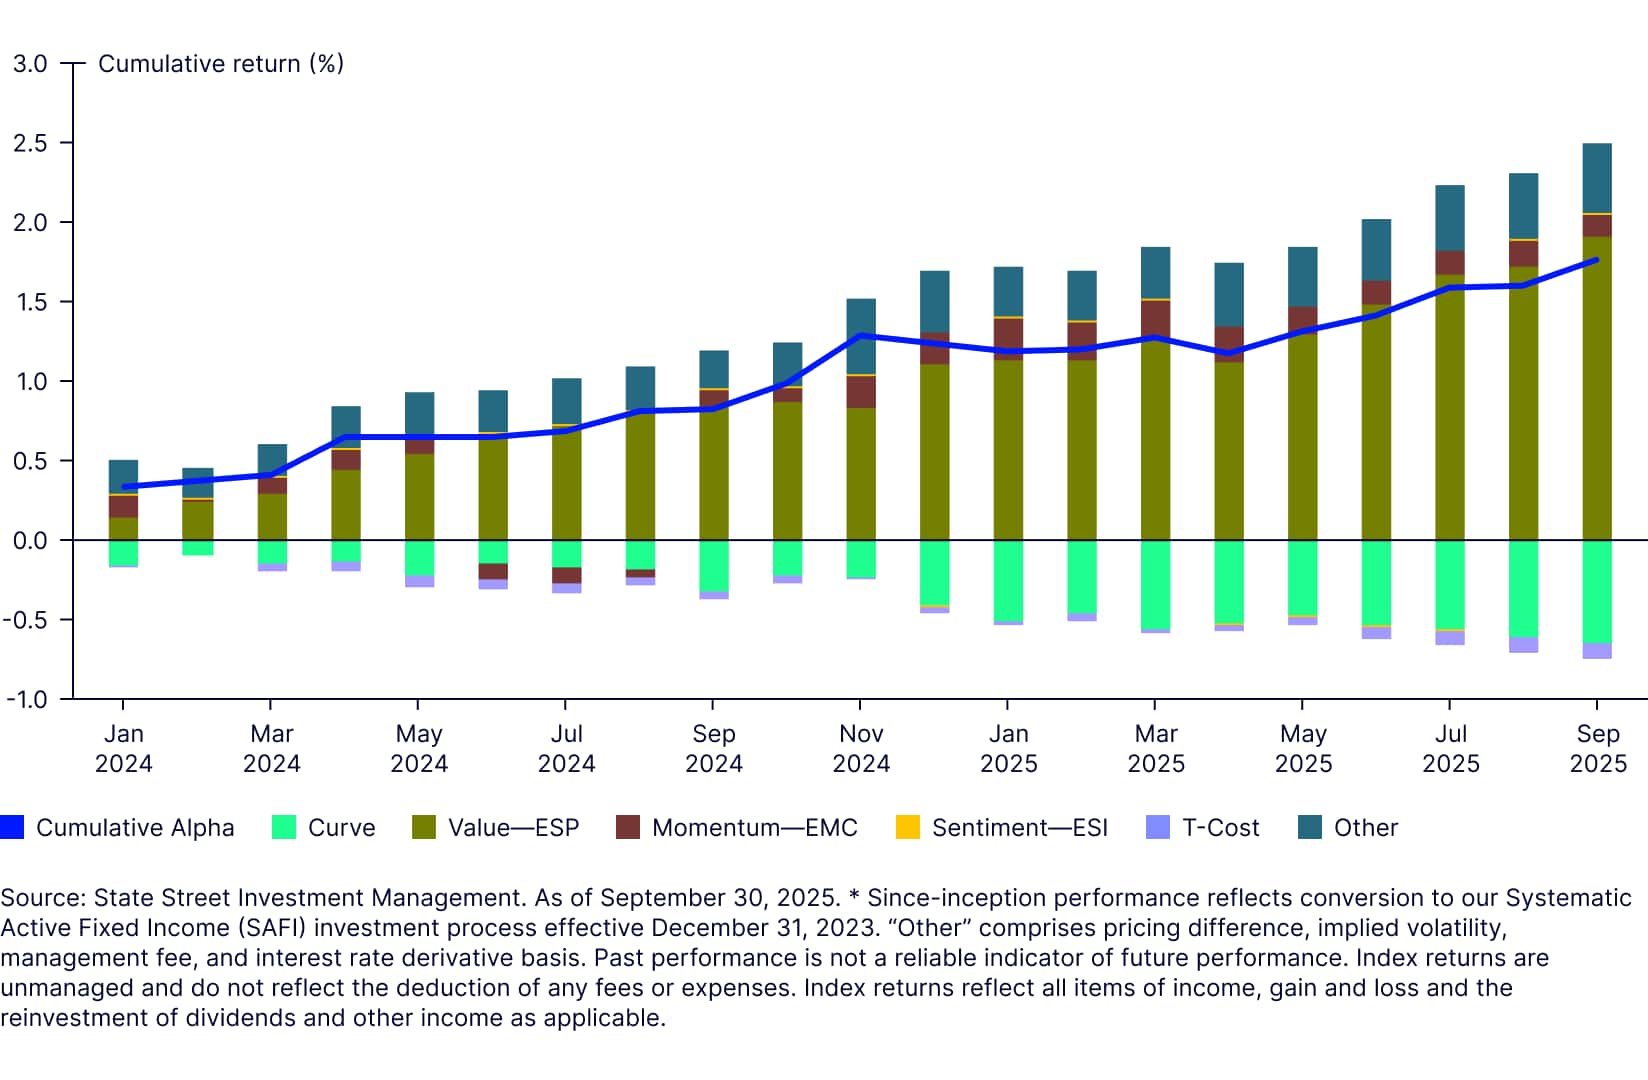
Figure 2: SAFI performance attribution
Intermediate strategy
Long strategy
An upbeat credit environment, but for how much longer?
Q3 saw a resilient US macro backdrop and a risk-on market environment with investment grade corporate spreads narrowing from already-rich levels near 77 basis points (bps) on July 4, 2025, to a low of roughly 72bps in September, representing the tightest spreads since 1998.1 This environment was conducive to continued performance from the Value factor, which contributed +14bps in the Intermediate strategy and +43bps in the Long. The Momentum factor was flat in the Intermediate strategy, and added +4bps in the Long.
Credit spreads have bounced off their tightest levels, but remain far away from showing clear value, while fundamentals and market technicals remain positive. No matter what the macro environment is moving forward, we remain objective and disciplined with respect to the alpha signals, our ability to add value in implementation, and our SAFI investment process overall.
SAFI strategies have generated top-decile information ratios
A key hallmark of our SAFI portfolios is their ability to deliver high risk-adjusted excess returns. Since SAFI’s inception at the end of 2023, the Intermediate strategy has delivered competitive second-quartile alpha with low realized tracking error, leading to a top-decile information ratio (IR) relative to the US Corporate Fixed Income manager universe in eVestment. The Long strategy has delivered top-decile alpha with modestly higher tracking relative to the US Long Credit Fixed Income manager universe, leading to an impressive top-third percentile IR.
Figure 3: Very competitive performance vs. active credit and long credit manager universes
US Corporate Fixed Income
| State Street Systematic High Quality Intermediate Corporate | Excess Return | Rank | Tracking Error | Rank | Information Ratio | Rank |
| 25th Percentile | 0.84 | 39 | 0.3 | 23 | 2.82 | 10 |
| Median | 1 | 0.31 | 2.39 | |||
| 75th Percentile | 0.63 | 0.45 | 1.7 | |||
| 0.42 | 0.6 | 0.73 |
US Long Duration - Credit Fixed Income
| State Street Systematic High Quality Long Corporate | Excess Return | Rank | Tracking Error | Rank | Information Ratio | Rank |
| 25th Percentile | 1.06 | 7 | 0.42 | 48 | 2.54 | 3 |
| Median | 0.79 | 0.32 | 1.91 | |||
| 75th Percentile | 0.53 | 0.44 | 1.09 | |||
| 0.18 | 0.61 | 0.39 |
Source: eVestment. As of September 30, 2025. Performance analysis uses monthly data gross of management fees from December 31, 2023, to September 30, 2025. * Since-inception performance reflects conversion to our Systematic Active Fixed Income (SAFI) investment process effective December 31, 2023. The gross performance reflects transaction costs but does not reflect management fees and other fees and expenses a client would have to pay, which reduce returns. Past performance is not a reliable indicator of future performance.
Performance deeper dive: Attractive return profile in risk-off and risk-on periods in 2025
SAFI offers clear differentiation and a solid value proposition for clients relative to other active managers in the space. During the credit drawdown/spread widening in Q1, the SAFI strategies were roughly flat, net of fees, while on average, credit managers underperformed their benchmarks by 35bps from March-April. In the subsequent spread tightening since April, SAFI maintained that consistent outperformance.
SAFI offers strong risk mitigation in relative terms too. Since January 2024, the average max alpha drawdown among the 73 managers in our sample was -44bps, with a sizable left tail of underperforming managers. During this almost two-year period, our SAFI intermediate strategy drew down by only -5bps relative to its benchmark—the second-best outcome in the universe.
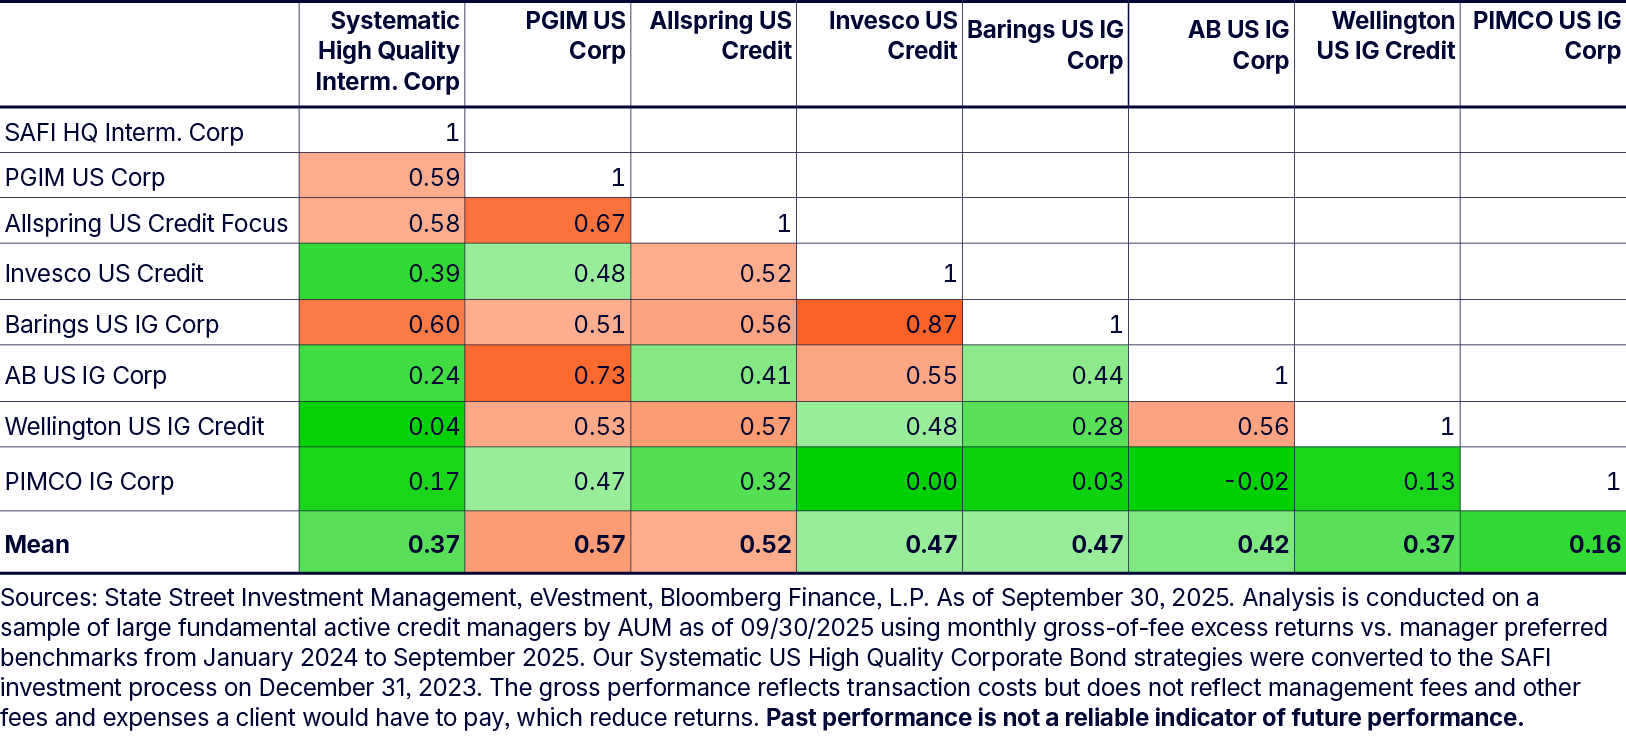
Lastly, SAFI offers a low correlation of excess returns relative to large fundamental active peers, suggesting it can play a complementary role in portfolios alongside an existing allocation of fundamental credit managers.
Figure 5: SAFI excess return profile is differentiated relative to active peers
The bottom line
Our SAFI approach continues to deliver strong, differentiated results for clients, with key benefits including:
- Competitive and consistent alpha that can be complementary to fundamental active
- A diversified factor-based approach that updates views (via alpha signal scores) rapidly and at scale
- A transparent process that delivers performance at a low cost relative to traditional active managers
Both the Intermediate and Long SAFI strategies are competitive with the top active managers in their respective credit universes. We’re proud of this accomplishment thus far as we approach two years of live track records, but this is just the beginning. We strongly believe that SAFI will play a key role in client portfolios in the coming years, acting as a complementary source of alpha alongside fundamental managers.
Learn More About SAFI’s Resilience