
Magnificent 7 no longer moving as one trade
The AI trade has broadened down the value chain, with semiconductor firms increasingly driving returns as the Magnificent 7 show wider divergence in performance, risk profiles, and fundamentals.
The AI trade has broadened down the value chain. While the Magnificent 7 (Mag 7) were the early beneficiaries of AI enthusiasm, leadership has shifted toward the semiconductor complex driven by accelerating hyperscaler capex on AI compute, memory, networking, and equipment. Year-to-date, the Mag 7 have lagged the S&P 500 by more than 7% and the PHLX Semiconductor Index by nearly 80%. The rotation reflects investor preference for the enablers of AI infrastructure over the platforms still absorbing the capex bill.
Weekly Highlights
Source: FactSet, as of July 10, 2026.
Source: FactSet, as of July 10, 2026.
Source: FactSet, as of July 10, 2026.
The Mag 7 isn’t one trade anymore
Over the past few years, the Magnificent Seven has been synonymous with market leadership, driving a disproportionate share of earnings growth and equity returns within the S&P 500. However, that leadership is becoming less concentrated as market participation broadens and performance within the group increasingly diverges. What was once viewed as a single investment theme is evolving into a collection of distinct businesses with materially different growth, monetization, and valuation profiles - challenging the notion that the Mag 7 can continue to be treated as a single, homogeneous basket.
Evidence of this shift is visible in index contribution dynamics. The Mag 7 accounted for 62% and 53% of S&P 500 returns in 2023 and 2024, respectively, highlighting the degree of market concentration. YTD in 2026, however, leadership has rotated toward a broader set of AI and semiconductor beneficiaries, with only three Mag 7 companies ranking among the top ten contributors to index performance. This points to a gradual transition from narrow concentration toward more distributed market participation.
| 2023 | 2024 | 2025 | 2026 YTD | |||||
| S&P 500 Total Return | 26.28% | 25.02% | 17.88% | 10.21% | ||||
| Rank | Security | Contribution | Security | Contribution | Security | Contribution | Security | Contribution |
| 1.00 | Microsoft | 3.49% | NVIDIA | 5.60% | NVIDIA | 2.77% | Micron | 1.62% |
| 2.00 | Apple | 3.24% | Apple | 1.84% | Alphabet Clas A | 1.34% | AMD | 1.01% |
| 3.00 | NVIDIA | 2.90% | Amazon | 1.49% | Microsoft | 1.33% | Intel | 0.84% |
| 4.00 | Amazon | 2.02% | Meta | 1.37% | Broadcom | 1.28% | NVIDIA | 0.63% |
| 5.00 | Meta | 1.71% | Broadcom | 1.23% | Alphabet Class C | 1.07% | Applied Materials | 0.62% |
| 6.00 | Tesla | 1.09% | Microsoft | 1.03% | JPMorgan | 0.54% | Lam Research | 0.56% |
| 7.00 | Alphabet Clas A | 0.99% | Alphabet Clas A | 0.69% | Palantir | 0.50% | SanDisk | 0.51% |
| 8.00 | Alphabet Class C | 0.88% | Tesla | 0.68% | Meta | 0.48% | Alphabet Clas A | 0.50% |
| 9.00 | Broadcom | 0.75% | Alphabet Class C | 0.58% | Micron | 0.42% | Apple | 0.40% |
| 10.00 | Eli Lilly | 0.53% | JPMorgan | 0.52% | Eli Lilly | 0.39% | KLA | 0.40% |
Source: FactSet, data as of July 10, 2026.
This shift is further reinforced by a sharp decline in intra-group correlations and a rise in return dispersion. The Mag 7’s average pairwise correlation has fallen to 0.27 on a three-month rolling basis, significantly below the 0.78 peak observed in mid-2025. At the same time, year-to-date performance dispersion has widened materially. Alphabet and Apple have delivered gains of 12.4% and 14.8%, respectively, while Microsoft (-21.4%) and Tesla (-11.3%) have declined sharply. A return spread of over 30 percentage points within a previously tightly correlated group signals a meaningful breakdown in the “single trade” narrative.
The structural case is equally difficult to defend. Five-year betas versus the S&P 500 range from 1.09x for Apple to 2.25x for NVIDIA, sorting the group into three distinct risk profiles: a high-beta cohort at 1.7-2.25x (NVIDIA, Tesla), a growth-cyclical middle at 1.2-1.5x (Amazon, Meta, Alphabet), and a market-like cohort at around 1.1x (Microsoft, Apple). Beneath the surface, the Mag 7 were never quite a homogeneous risk exposure - the market simply treated them as one while a common AI narrative and shared earnings tailwinds masked the differences underneath. That shortcut no longer holds; each name needs to be assessed on its own merits.
| Security | 5Y Beta |
| Nvidia | 2.25 |
| Tesla | 1.76 |
| Amazon | 1.46 |
| Meta | 1.25 |
| Alphabet | 1.24 |
| Microsoft | 1.12 |
| Apple | 1.09 |
Source: FactSet. Monthly data from July 2021 to June 2026.
The market is pricing these companies differently, but the divergence in performance is ultimately grounded in their fundamentals. AI-related spending, monetization prospects, and capital allocation decisions are increasingly driving performance dispersion across the group. Within the Mag 7, four companies have emerged as hyperscalers, leading AI infrastructure investment, while others remain more closely tied to their established businesses. Investors are also becoming increasingly selective in how they assess the hyperscalers, placing greater weight on earnings delivery, cash-flow generation, and evidence of sustainable ROI. Alphabet provides a clear example. Once viewed as an AI laggard, the company has gained favor with investors as accelerating cloud growth and expanding AI-driven demand have strengthened confidence that its substantial AI investments can generate durable revenue growth and justify elevated capital spending.
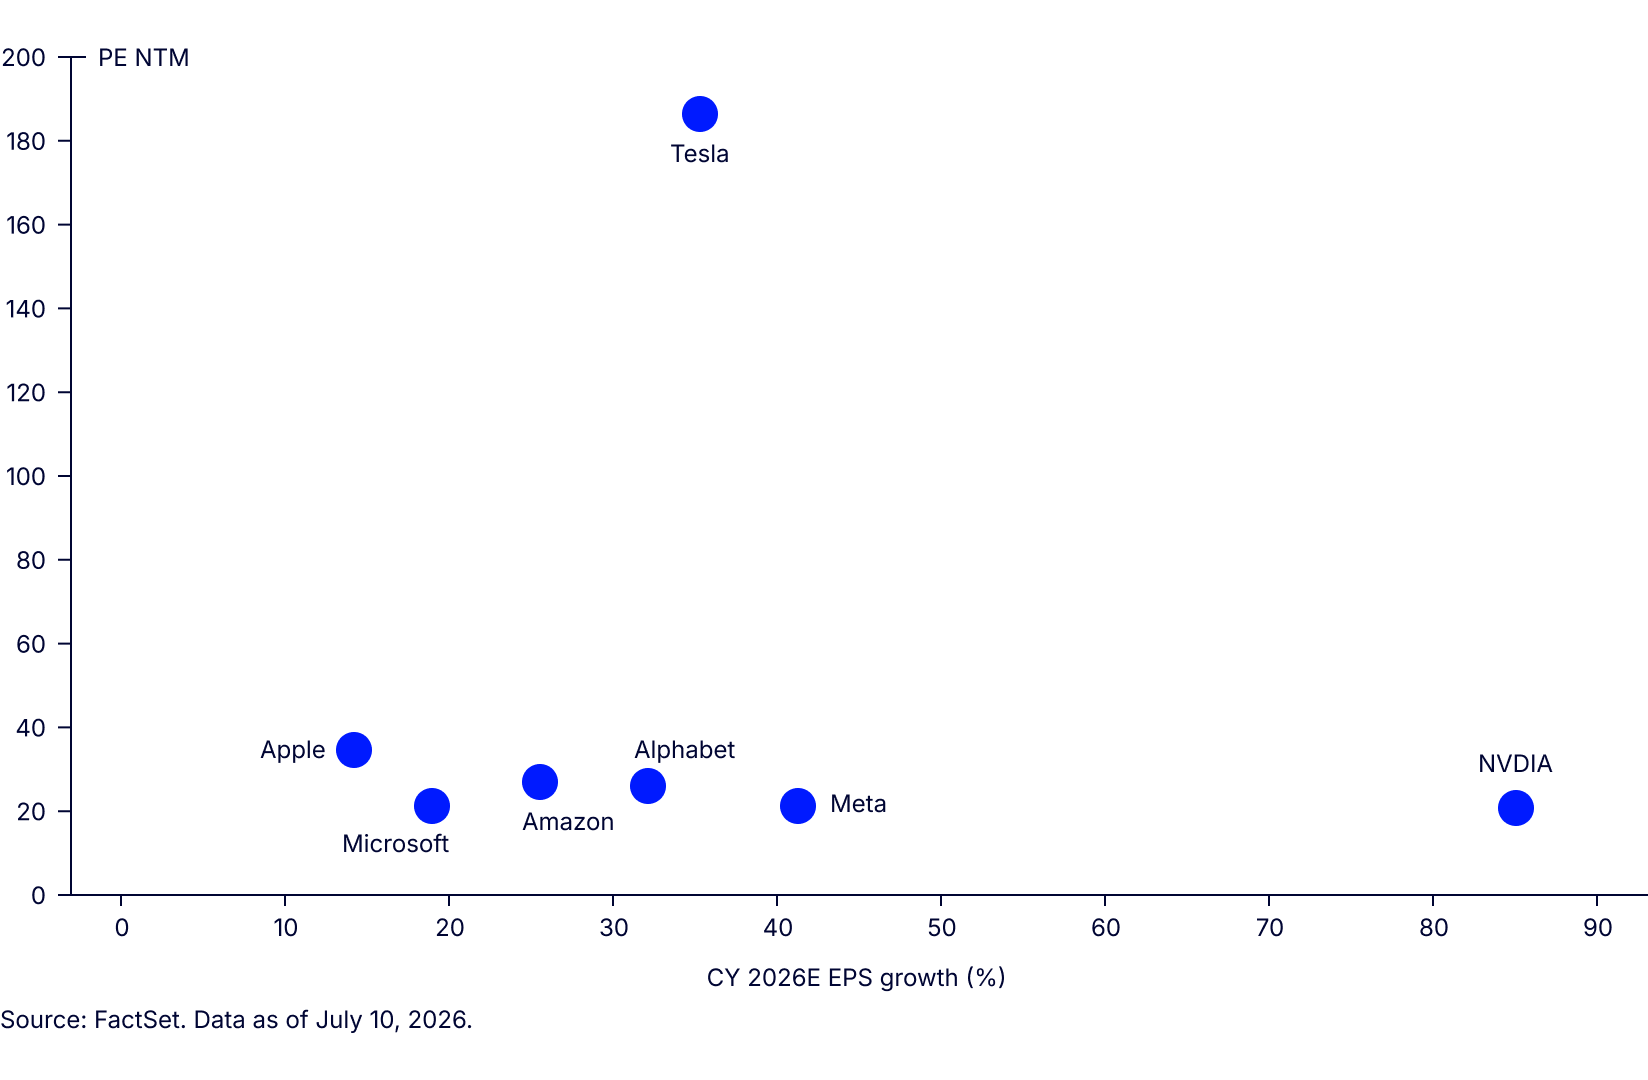
The underlying data tells the same story; the group's financial profiles have visibly diverged. NTM P/E multiples now span 19.7x to 184.8x, and CY2026 EPS growth expectations range from 14% to 85% - a spread that is difficult to reconcile with a single-basket view. In parallel, the group’s dominance in global market capitalization rankings is being challenged, with companies such as Broadcom and Micron overtaking some Mag 7 constituents. This level of heterogeneity is inconsistent with a basket-based investment approach and instead calls for granular, stock-specific analysis.
PE NTM VS CY 2026E EPS Growth (%)
The implication is straightforward: future returns are likely to depend less on broad exposure to the theme and more on identifying the companies best positioned to convert AI-related spending into durable earnings growth.
Source: State Street Investment Management, FactSet, PHLX, S&P. Data as of 7/10/2026 unless otherwise stated. Total returns in USD unless otherwise stated. The performance data quoted represents past performance. Past performance does not guarantee future results. Investing involves risk, including the risk of loss of principal.

Go beyond the headlines...
Skimmed the summary? Dive deeper with the full PDF—your go-to for weekly market insights and analysis.