Systematic High Quality Corporate Fixed Income: Q1 2026 commentary
- Markets were dominated by geopolitical shocks that disrupted energy markets and raised volatility levels; despite a late-quarter reversal, markets largely absorbed the deteriorating newsflow.
- Our SAFI strategies continued to perform well, delivering consistent alpha in the latest quarter, driven by complementary factor behavior—notably in value and momentum.
- Higher volatility contributed to increased dispersion in factor scores, helping to expand the opportunity set; systematic, continuous rebalancing helped capture those opportunities.
Amid elevated uncertainty, follow the alpha signals for strong, consistent investment outcomes
Geopolitical tensions were at the heart of the market narrative in Q1 2026. From the US capture of Venezuelan President Nicolas Maduro in early January to the US-Israel strikes on Iran in late February that sparked retaliation, the impact on global energy markets in particular has been immense. For broader financial indexes, the returns for Q1 suggest that investors had largely taken the deteriorating backdrop in stride, although the reversal in March was not insignificant. As is always the case during periods of uncertainty, we remain disciplined in our Systematic Active Fixed Income (SAFI) approach, relying on our time-tested value, momentum, and sentiment signals to guide security selection. The performance of our strategies in the latest quarter is reflected in Figure 1.
Figure 1: SAFI maintains performance in Q1 2026
| Intermediate (1-10Yr) Portfolio | Long (10+ Yr) Portfolio | |||||
| QTR (%) | 1 Year (%) | Since SAFI Inception (%)* | QTR (%) | 1 Year (%) | Since SAFI Inception (%)* | |
| Systematic US High Quality Corporate Bond (Gross) | 0 | 5.69 | 5.24 | -0.59 | 4.42 | 1.95 |
| Benchmark | -0.19 | 5.10 | 4.49 | -1.20 | 3.55 | 0.97 |
| Excess Return (Gross) | 0.19 | 0.58 | 0.75 | 0.62 | 0.87 | 0.98 |
| Systematic US High Quality Corporate Bond (Net) | -0.04 | 5.50 | 5.05 | -0.63 | 4.23 | 1.77 |
| Benchmark | -0.19 | 5.10 | 4.49 | -1.20 | 3.55 | 0.97 |
| Excess Return (Net) | 0.15 | 0.39 | 0.56 | 0.57 | 0.69 | 0.80 |
| Tracking Error Volatility | 0.14 | 0.27 | 0.58 | 0.50 | ||
| Information Ratio | 4.04 | 2.78 | 1.51 | 1.95 | ||
Source: State Street Investment Management. As of March 31, 2026. The Systematic US High Quality Corporate Bond portfolios were converted to the SAFI investment process as December 31, 2023.
The performance data quoted represents past performance. Past performance does not guarantee future returns. Performance returns for periods of less than one year are not annualized. The performance figures contained herein are provided on a gross and net of fees basis. Gross of fees do not reflect and net of fees reflect the deduction of advisory or other fees which could reduce the return. The performance shown is of a composite consisting of all discretionary accounts using this investment strategy. The above information is considered supplemental to the GIPS presentation for this Composite, which can be found in the Appendix or was previously presented. A GIPS presentation is also available upon request.
* Inception Date: December 31, 2023. Fund history predates this period; however, it was not managed using the SAFI approach. The benchmark for the SAFI intermediate strategy is the Bloomberg Intermediate Corporate ex Baa Index. The benchmark for the SAFI long strategy is the Bloomberg Long Corporate A+ Index.
From SAFI inception in December 2023 through March 2026, our Systematic US High Quality Corporate strategies delivered alpha and risk outcomes that, in many instances, ranked near the top of the US active credit manager eVestment universes, gross of management fees.
Figure 2: Performance characteristics vs. the active manager universe (Jan 2024 – Mar 2026)
| US Corporate Fixed Income | Excess Return | % Rank | Tracking Error | % Rank | Information Ratio | % Rank | Max Alpha Drawdown | % Rank |
| State Street Systematic High Quality Interm. Corp | 0.75 | 34 | 0.28 | 5 | 2.72 | 1 | -0.05 | 2 |
| 25th Percentile | 0.90 | 0.33 | 1.84 | -0.17 | ||||
| Median | 0.55 | 0.46 | 1.28 | -0.31 | ||||
| 75th Percentile | 0.30 | 0.67 | 0.72 | -0.55 | ||||
| US Long Duration - Credit Fixed Income | ||||||||
| State Street Systematic High Quality Long Corp | 0.97 | 8 | 0.51 | 53 | 1.9 | 5 | -0.27 | 36 |
| 25th Percentile | 0.66 | 0.32 | 1.42 | -0.21 | ||||
| Median | 0.45 | 0.49 | 0.81 | -0.38 | ||||
| 75th Percentile | 0.16 | 0.67 | 0.33 | -0.53 | ||||
Sources: eVestment. State Street Investment Management. As of March 31, 2026. Performance analysis uses monthly data gross of management fees from December 31, 2023, to March 31, 2026. The gross performance reflects transaction costs but does not reflect management fees and other fees and expenses a client would have to pay, which reduce returns. The performance data quoted represents past performance. Past performance does not guarantee future returns.
Factor alignment and high dispersion drove strong performance
Evaluating SAFI results requires understanding how factors behave, when they tend to work (or not), and how they interact. Value is typically the main source of outperformance in most environments. Momentum plays less of a role in driving performance when spreads are rangebound, but this factor tends to be most powerful during periods of credit weakness.
Figure 3a shows value and momentum factor performance since SAFI inception.1 Over this period, we have experienced three notable episodes of credit weakening: Yen carry trade unwind in August 2024, Liberation Day in April 2025, and the Iran War in March 2026. In contrast to many active peers, our SAFI portfolios generated consistent outperformance (or effectively limited downside risk) through each of these environments, as highlighted in Figure 3b.
Figure 3a: Momentum outpaces value as main driver of outperformance during credit weakness

Figure 3b: Alpha vs. active US credit manager peers during credit drawdowns
| Excess Return vs. Benchmark | |||||
| Total Return | US Corporate Manager Universe | ||||
| Month | Bloomberg US Corporate Index | SAFI HQ Intermediate | First Quartile | Median | Third Quartile |
| 26-Mar | -1.98 | 0.02 | 0.05 | -0.02 | -0.11 |
| 25-Apr | -0.03 | 0 | 0.01 | -0.11 | -0.19 |
| 24-Aug | 1.57 | 0.05 | 0.12 | 0.04 | 0 |
| Excess Return vs. Benchmark | |||||
| Total Return | US Long Credit Manager Universe | ||||
| Month | Bloomberg US Long Corp Index | SAFI HQ Long | First Quartile | Median | Third Quartile |
| 26-Mar | -3.21 | 0.35 | 0.11 | 0.03 | -0.06 |
| 25-Apr | -1.29 | -0.11 | 0.08 | 0 | -0.1 |
| 24-Aug | 2.12 | 0.13 | 0.13 | 0.03 | -0.01 |
Sources: State Street Investment Management, Bloomberg. As of March 31 2026. Months highlighted correspond to periods of heightened spread volatility. Performance shown is gross of management fees. The gross performance reflects transaction costs but does not reflect management fees and other fees and expenses a client would have to pay, which reduce returns. The performance data quoted represents past performance. Past performance does not gurantee future returns.
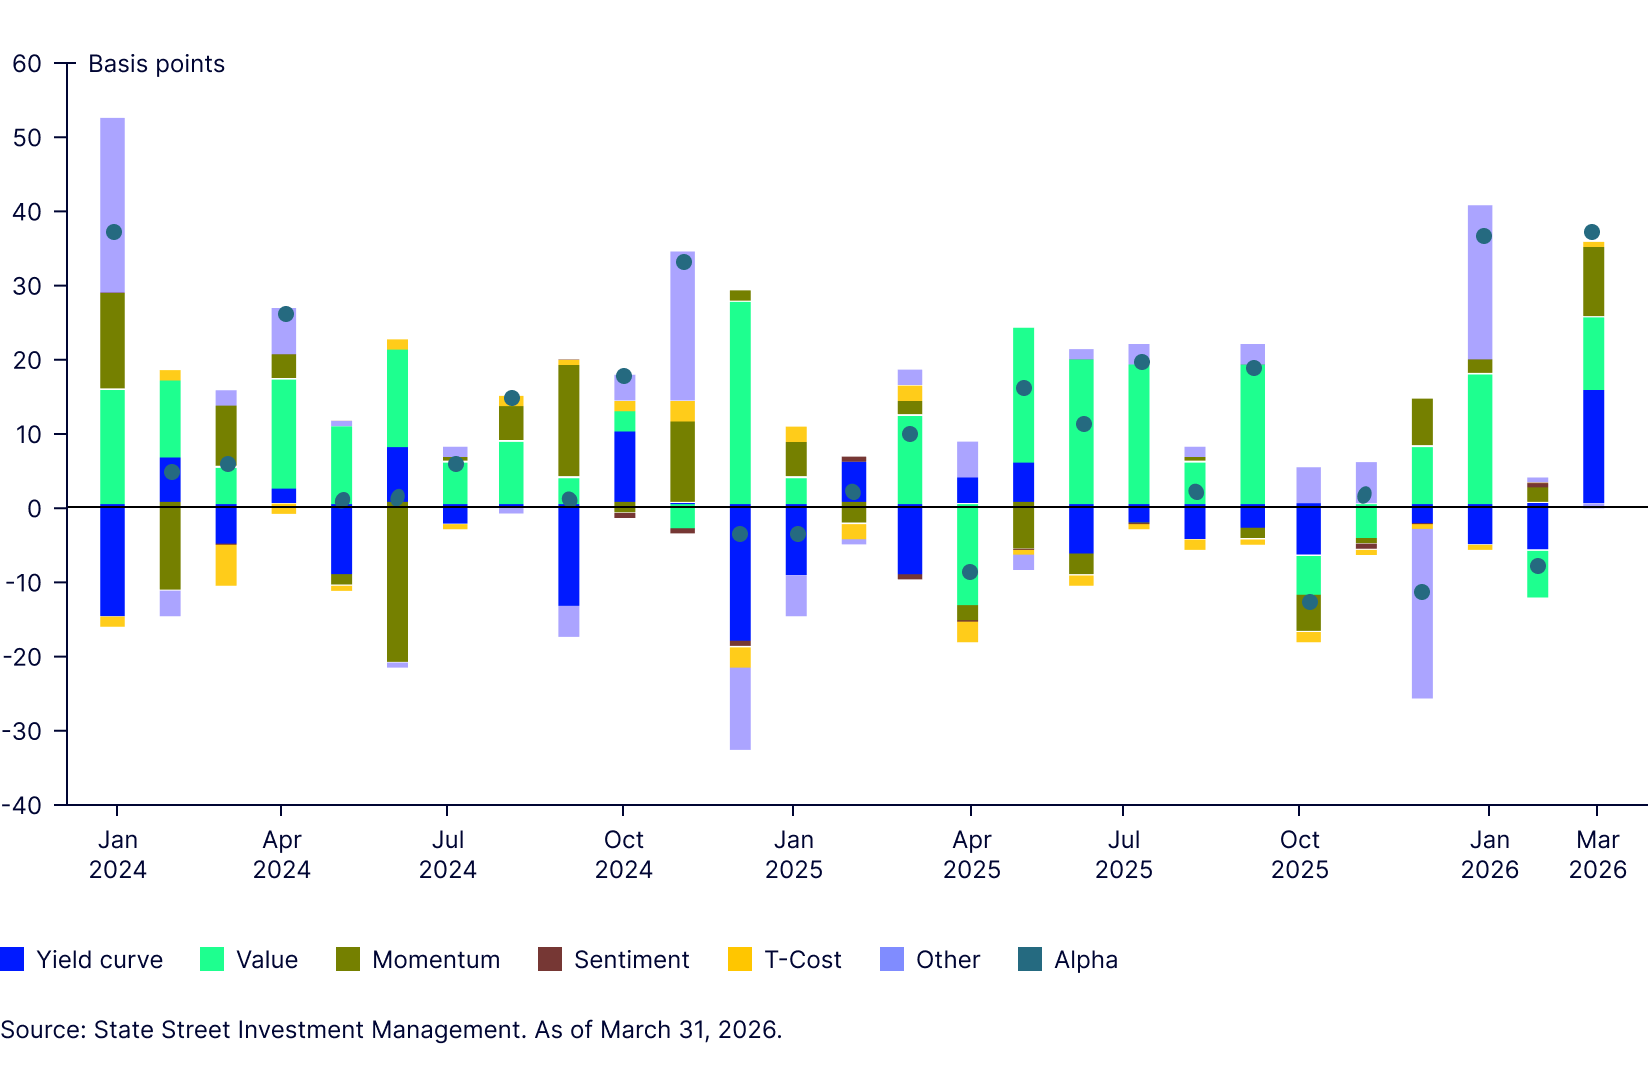
Figure 4a also highlights that factor behavior is often complementary, with value and momentum frequently offsetting each other – an important contributor to the consistency of SAFI’s alpha generation across regimes. In March, the market environment was constructive for SAFI because value and momentum were aligned and positive. In February, spread widening created value opportunities. At the same time, momentum2 tilted our portfolios towards attractive issuers/sectors that performed well and underweighted those that did not.
Having tightened to new multi-decade lows of 70 basis points (bps) in January, US investment grade corporate spreads widened to over 90 bps by the end of the quarter, while Treasury yields rose sharply as inflation concerns intensified against the backdrop of surging energy prices. Despite these moves, our SAFI strategies generated strong and consistent outperformance, underpinned by diversified factor contributions and attractive drawdown characteristics. In March, SAFI HQ Long delivered 35 bps of alpha, including 9 bps from value and 9 bps from momentum.
Figure 4a: SAFI HQ Intermediate strategy contribution to alpha since inception

Figure 4b: SAFI HQ Long strategy contribution to alpha since inception
* Since-inception performance reflects conversion to our Systematic Active Fixed Income (SAFI) investment process effective December 31, 2023. “Other” comprises pricing difference, implied volatility, and management fee. The performance data quoted represents past performance. Past performance does not guarantee future returns.
Dispersion created opportunity, systematic rebalancing captured it
The rise in market volatility created the high dispersion in factor scores, particularly in March, creating broad scope to improve portfolio factor scores through efficient day-to-day turnover. Capturing the opportunities requires disciplined, systematic rebalancing.
Security-level attribution in March supports this: the distribution of factor contributions by ticker in the long strategy was right-skewed (Figure 5). Of the 344 tickers that were in either the long portfolio or its benchmark, 225 provided positive contributions, adding 42.5 bps, while 119 detracted, subtracting 23.6 bps. This efficacy across a broad range of market environments, including credit drawdowns, is exactly what we target in our SAFI portfolios.
Maintain objectivity and agility through volatility via alpha signals
The SAFI process keeps the portfolio systematically allocated to bonds that are most attractive based on empirically supported alpha signals. By maintaining continuous, efficient exposure to these factors, we have a strong belief the strategies can outperform and support clients’ objectives over the long run. Importantly, even in periods of high uncertainty and volatility, the signals help us reposition nimbly and objectively—without relying on discretionary reactions to headlines.
For additional insights and to learn more about SAFI at State Street Investment Management, please visit our website