The Pathway Back to Negative Stock/Bond Correlation
The traditional view of an up-in-quality fixed income allocation1 is partly driven by its historical negative correlation with equities—a relationship that has held true over the past two decades.2 Multi-asset-class investors have relied upon the diversification benefits associated with this relationship to hedge equity beta risk. However, last year,3 this relationship turned positive, leaving many investors wondering what could drive the typical negative correlation to resurface.
In this paper, we look at the main drivers of stock/bond correlation, explain why positive correlation has developed in today’s market and consider what could change it.
Markets are keyed into inflation trends
When economic growth data is determining the market’s palate for risk, it makes sense that rising growth would lead to a “risk-on” posture, with investors demanding more higher-beta securities and less lower beta (i.e., a negative stock/bond correlation).
However, today, we are on a different playing field. Attention to growth has been overshadowed by a laser focus on inflationary concerns. When data indicates that growth is improving, the market instead concentrates on potential rising inflation, increasing yields and decreasing the equity risk premium (ERP). This causes price declines in both stocks and bonds (i.e., a positive correlation).
Figure 1 shows the relative importance of growth concerns to inflation concerns for markets, and how it has correlated with stock/bond correlation.
- Prior to 2000: The ratio of Industrial Production volatility to CPI volatility was falling, indicating that inflation concerns were dominating growth concerns. Lofty inflation due partly to oil price shocks correlated with a positive stock/bond correlation.
- From 2000 to 2019: The ratio of Industrial Production volatility to CPI volatility was rising, indicating that growth concerns were on market participants’ minds more than inflation concerns, as the inflation rate was stubbornly low and stable at 2%. During this period, the stock/bond correlation fell into negative territory.
- In recent years: Inflation has exerted its dominance largely due to the emergence of global price increases post-COVID lockdowns. Stock/bond correlation has turned positive, ending 2022 at 0.16.
Figure 1: The Market’s Emphasis on Growth versus Inflation Could Impact Stock/Bond Correlation

Figure 2 shows these drivers of correlation in a different way. In this chart, we define a market concerned for inflation as one experiencing high GDP growth and high inflation. By contrast, a market concerned for growth is one with low GDP growth and low inflation.
From 1976 to 1999, US Real GDP growth averaged 1.13%, while inflation averaged 4.86%. Inflation was a greater concern, which may help explain the positive correlation over the period.
From 2000 to 2022, US real GDP growth averaged 0.66%, while inflation was still modest at an average of 2.49% This resulted in a market focus on growth, and a negative correlation between stocks and bonds.
Figure 2: Low Growth, Low Inflation Corresponds with Negative Correlation

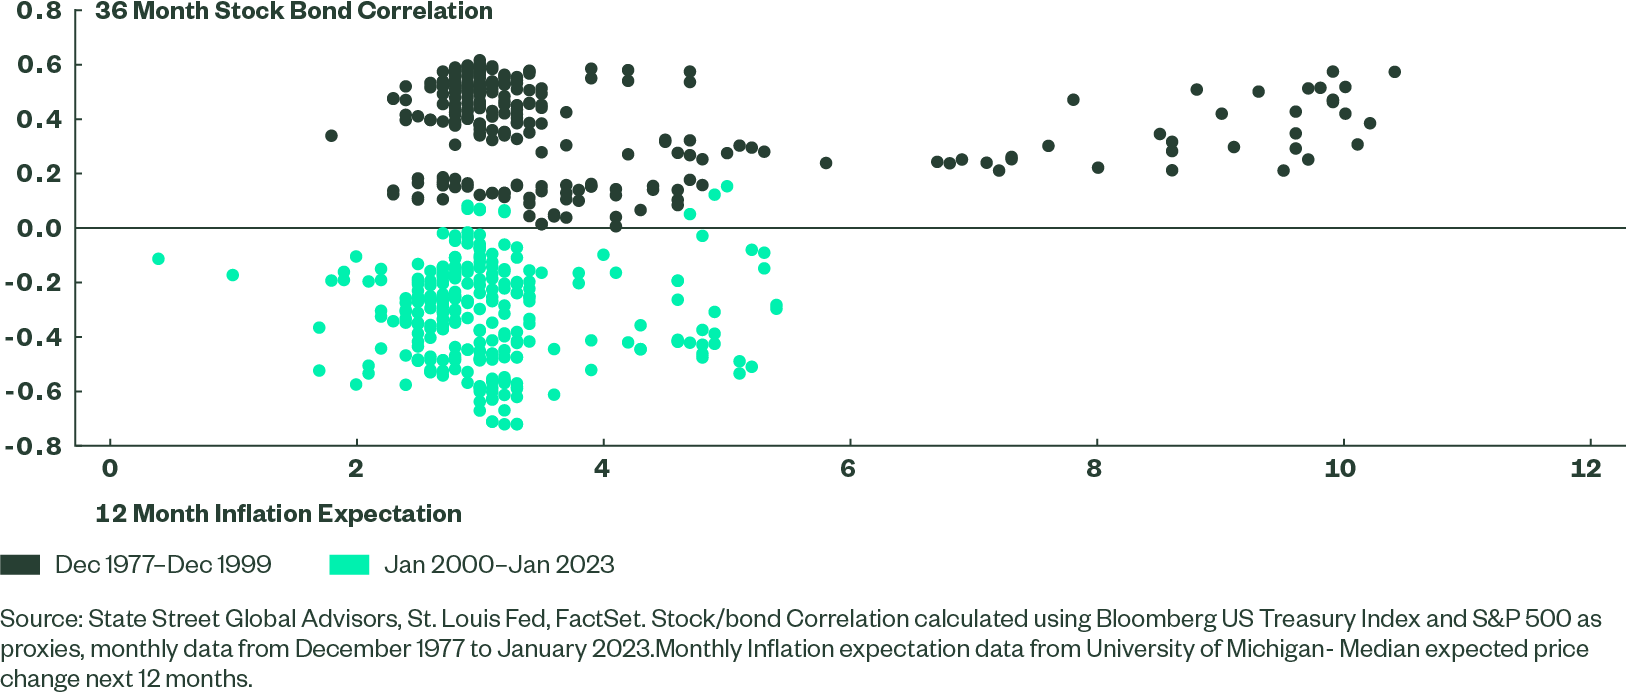
Furthermore, inflation expectations may have further pushed the ERP lower from 1978 to 2000 by boosting the already-rising discount rates. Figure 3 shows that in the 1970s and 1980s, inflation expectations were impacted by the stickiness of high inflation over a protracted period. As actual inflation continued rising, inflation expectations surged as well, further decreasing the ERP. By contrast, more stable inflation expectations (such as those of the post-2000 era) have corresponded with a negative correlation.
Figure 3: Inflation Expectations Can Also Impact Stock Bond Correlation
ERP and Positive Correlation Explained
The ERP is the additional compensation demanded by the market for owning stocks instead of bonds. Higher inflation can kick of a cycle that leads to positive correlation, as follows: Higher inflation raises discount rates and bond yields. With higher yields available, the ERP falls, as less compensation is required to take on the additional risk of stocks. However, this also means that bonds are more attractive relative to stocks, putting downward pressure on stock prices. Hence, both stock and bond prices are decreasing. Currently, the S&P 500 ERP is at its lowest level since 2007,4 giving clarity to today’s positive correlation.
Impact of Fed Monetary Policy on Stock/Bond Correlation
Figure 4 indicates the difference between the Effective Fed Funds rate and the policy rate, and is calculated based on Taylor’s rule. A positive difference implies monetary policy is restrictive, and a negative value implies expansionary monetary policy. Given the recent banking crisis and general slowdown in economic data, as indicated by the US ISM PMI data, the Fed is likely approaching its peak policy rate. In fact, the market is now predicting rate cuts in 2023. In time, as inflation falls and hawkish policy wanes, so too will the co-movement in stock and bond prices.
Figure 4: Monetary Policy Can Influence Stock/Bond Correlation

Stock/Bond Correlation in the Future
In conclusion, data shows that inflation and growth may have asymmetric effects on stock/bond correlation; inflation shocks have tended to correspond with positive correlation, while growth news tends to correspond with negative correlation.
We consider what may prompt stock/bond correlation to become negative again. Today, as we are late in the business cycle, growth could further compress, leading to a flight to quality and a market less worried about inflation. A typical risk-off response could ensue, bringing negative correlation back to the investment landscape.
Fed Chair Powell was recently quoted as saying, “We will get inflation back to 2%, over time,”5 and core PCE is currently projected to be approximately 3.6% in 2023. Additionally, the market supports this trajectory, as the 3yr US Breakeven Rate is currently 2.17%.6 Right now, the FOMC predicts modestly positive growth in 2023 and has revised 2024 forecasts downward by 25%. The SSGA forecast for US GDP Growth resides at 0.9%, an unfavorable view for the economy. Consequently, Inflation in the US is forecasted to be around 4% for calendar year 2023. Of these forecasts, the GDP print is most concerning, as the path of inflation seems to be trending in the right direction. The return of greater growth uncertainty tends to create lower stock/bond correlations.