De-Risking Effectively Using Fixed Income Building Blocks
With rates still elevated, volatility still near historical lows and US equities posting record highs, corporate defined benefit (DB) plans’ funding ratios remain solid. DB funding status reached 104.9% as of February 29, 2024, up about 3% versus a year prior. As a result, pension plans continue to seek to efficiently de-risk and increase allocation to fixed income. However, it is important that de-risking is performed thoughtfully to achieve each plan’s goals.
De-risking is an important strategic tool for plans practicing liability-driven investing (LDI). De-risking carried out through a shift from return-seeking assets (such as equities and real assets) toward liability-hedging assets (high-quality, long-duration fixed income) has been a dominant theme for corporate DB plans over the past decade. However, there are important pitfalls in using standard long-dated indexes to hedge the interest rate movements that could impact the plan’s expected liability stream. These pitfalls could prevent LDI investors from accomplishing their investment goals.
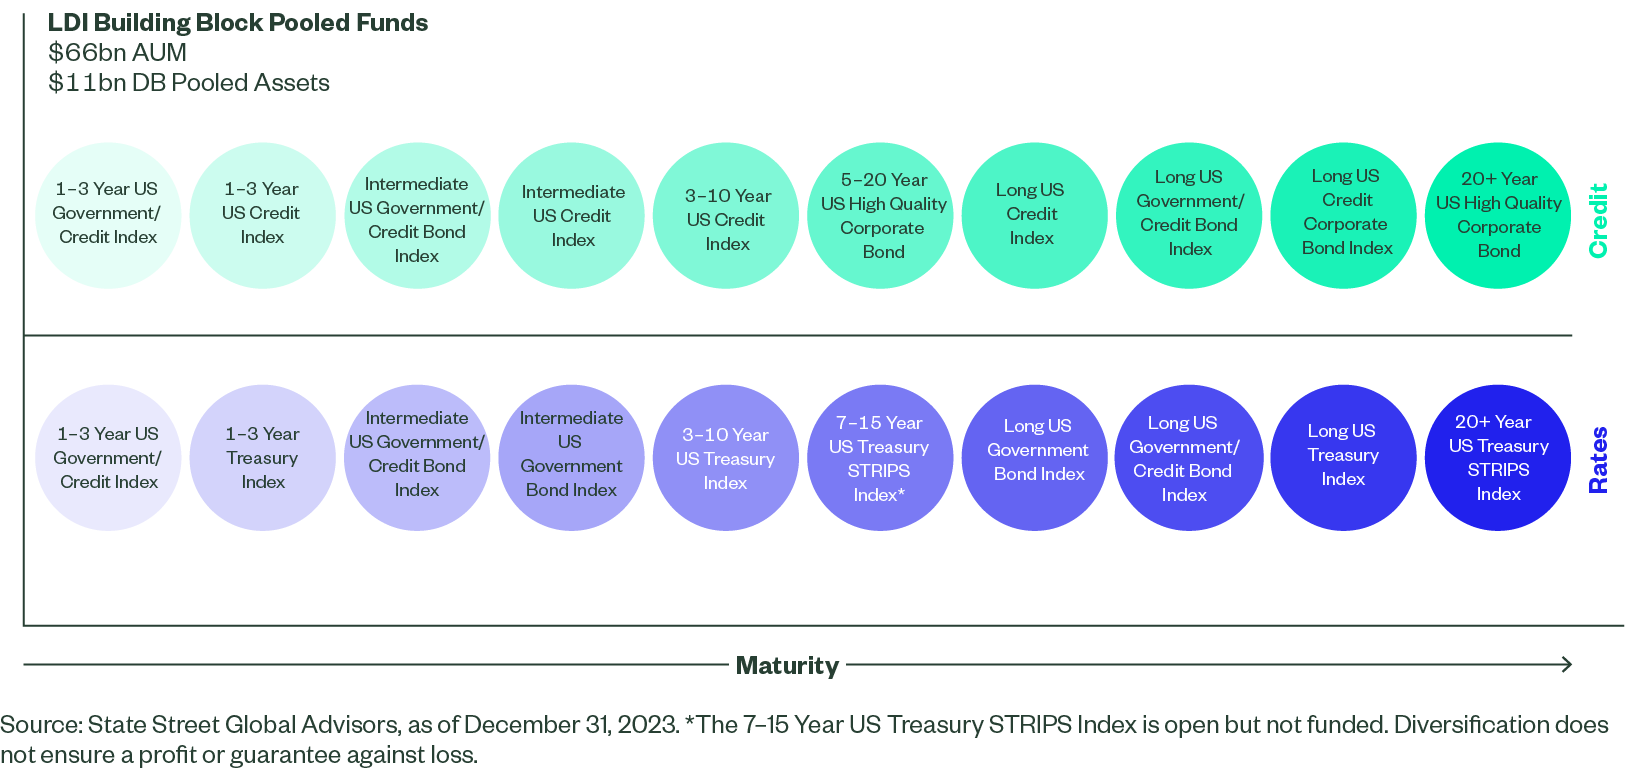
Our platform of LDI Building Block funds has been used by plan sponsors and their advisors to replicate liability structures and to fill in gaps in their existing asset structure. These funds represent a full spectrum of both interest rate and credit curve exposures that allow sponsors to create highly customized asset exposure while investing exclusively in commingled investment vehicles (Figure 1). Our range of rates strategies covers a broad landscape from short-term to long-term. In addition to Long Corporate Credit Index exposure, Credit Building Blocks include index points across the ratings spectrum.
In this piece, we discuss our LDI Building Block funds, give case studies of how the funds are compatible with the needs of plans that are de-risking via fixed-income allocations, and explain the benefits of scale. Assets allocated to fixed income have grown to represent about half of the typical corporate plan, with many sponsors using the increase in fixed income allocation to extend the portfolio duration and increase their plan’s hedge ratio. As plans progress through their de-risking journeys, allocating more assets to fixed income as funded status improves, they may begin to focus more closely on the composition of those assets and their relationship to liabilities. As no two plans are identical (given various liability profiles, levels of plan funding, sponsor profiles, approaches, and risk tolerances), we also note that a high level of customization of fixed-income exposure is often needed to provide satisfactory outcomes.
Figure 1: LDI Building Block Pooled Funds
LDI Building Blocks in Action
While plans have different investment goals and structures, overall, the objective of LDI is to reduce funded ratio volatility or the variability in the value of plan assets relative to the net present value of liabilities. Sponsors use a wide range of levers to control factors and risks that can impact funding status variability. While there will always be factors outside of sponsors’ control — actuarial experience versus modeled, for example — asset allocation following a de-risking glidepath generally shifts assets toward long-dated, high-grade fixed income as a way to mimic the risk characteristics of liabilities. This control objective results in fixed-income exposure generally being more tightly risk managed via active and indexed strategies to limit surprise outcomes.
The State Street Global Advisors LDI Building Blocks funds can be an important tool for sponsors seeking this control when implementing their LDI programs. We will present three problem-solution case studies that illustrate the flexibility of the platform.
Problem: Asset-Liability Mismatching Due to Credit and Duration Differences
In this first illustration, we constructed an asset portfolio exclusively using LDI Building Block funds. For smaller plans, in which separate account management might lead to unacceptable compromises such as high costs (management fees, trading and operating expenses) or inadequate diversification, the LDI path forward has often led to plans accepting mismatches between standard LDI benchmarks (such as the Bloomberg Long Government-Credit Index, or BBG Long GC) and plan liabilities. For the purposes of this illustration, we assume a plan with the following hypothetical characteristics (Figure 2):
Figure 2: Hypothetical Plan with Standard BBG Long GC Index Assets
| PBO Liabilities | $200 million |
| Liability Duration (Years) | 11.4 |
| NAV Asset Portfolio | $180 million |
| Funded Status | 90% |
| Asset Mix | 30% Return Seeking/70% Liability Hedging |
Source: Bloomberg, State Street Global Advisors. For illustrative purposes only.
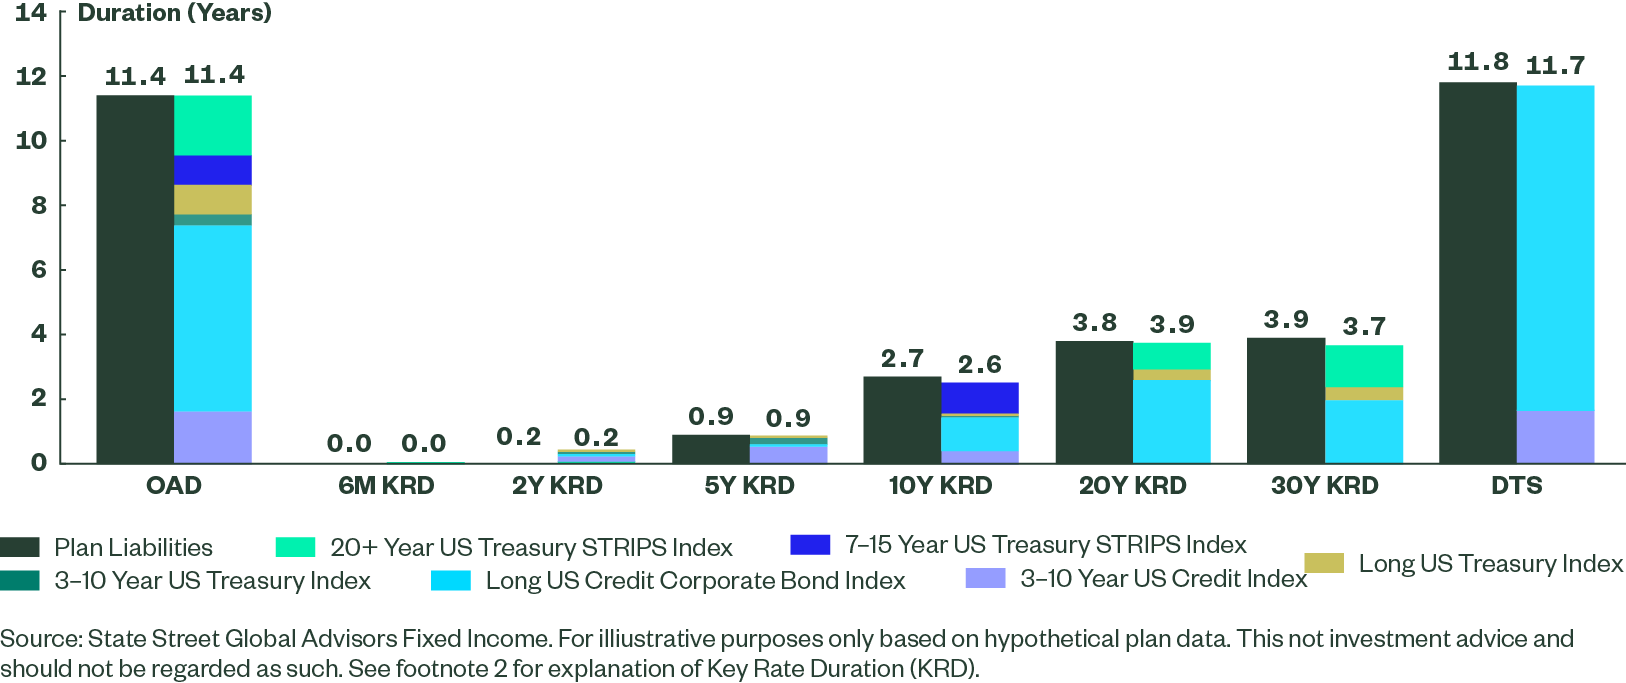
While many investors use the BBG Long GC as a proxy for their liabilities, a closer look at key risk statistics suggests a large mismatch between the plan duration and the BBG Long GC duration (Figure 3), meaning that they are not effectively reaching their goals to reduce funding status volatility in the face of interest rate movements.
Specifically, the BBG Long GC has significantly more sensitivity to very long-dated assets (represented by the 20-year and 30-year key rate duration (KRD) categories).2 By contrast, the plan liabilities are more equally sensitive to rate factors across the curve. Changes in the shape of the yield curve will not be hedged appropriately for this plan. While higher rates will reduce plan liabilities, a steeper yield curve — with rates in the long end rising more than those at the short end — will increase the underperformance of the plan assets (the BBG Long GC) relative to the plan liabilities.
A second risk factor comes in the form of credit exposure, which we’ve captured in the bars labeled DTS for the liabilities and the Long GC in Figure 3. DTS refers to duration times spread and measures credit sensitivity, based on the premise that bonds with higher-yield spreads are inherently riskier instruments. While credit assets comprise only 56% of the BBG Long GC, the composition of those assets is significantly riskier than the AA-rated corporate discount rate methodology adopted by most plans. Therefore, widening credit spreads could pull down plan asset values more than bring down liabilities.
Considering the yield curve mismatch reflected by the difference in duration sensitivities along with the credit mismatch captured by DTS, if this plan relies on the BBG Long GC to hedge liabilities, the plan could see a fairly wide distribution of funded status outcomes — even though it has substantially shifted its allocation to fixed income.
Solution: Liability Replication Using Liability-Matching Benchmark
Using a combination of LDI Building Blocks funds, we’ve optimized a portfolio structure to more precisely match assets with liability characteristics, addressing the duration and spread mismatches presented above in Figure 3.
Our first step is to match credit sensitivity using DTS as a measure. By starting with credit, we are able to address any plan-specific considerations that might be prompting the mismatch in credit exposure. In this illustrative optimization (Figure 4), we allow for a minimum investment grade rating on credit exposure, but we create it using a combination of long-, intermediate- and short-dated exposures.
We then seek to fill out curve exposure using US Treasury instruments by targeting gaps in key rate exposure from the liability stream. As with credit exposure, we can accomplish this by allocating to various maturity Treasury funds. Given the emphasis on long-dated liabilities, we also make an allocation to the 20+ Year U.S. Treasury STRIPS Index Strategy, which precisely targets those longest key rates.
Figure 4: Hypothetical Plan Matched with Building Blocks
Operationally, we can use this optimized portfolio to create what we refer to as a custom LDI benchmark and then automatically rebalance it on a monthly basis to maintain the integrity of the match over time.
The benefit of achieving a closer asset-liability match is reduced uncertainty and correspondingly, a narrower range of funded status outcomes as compared to a one-size-fits all investment in a fund benchmarked to the BBG Long GC (Figure 5):
Figure 5: Sample Plan to Address Asset-Liability Mismatch
Projected Tracking Error of Liabilities Relative to:
| BBG Long GC Index | Custom LDI Benchmark |
| 4.60% | 1.16% |
Source: Bloomberg, State Street Global Advisors. For illustrative purposes only.
Problem: How to Approach De-Risking in Today’s Higher-Rate Environment?
Our next case study considers a plan that is 95% funded with a simplistic 60% diversified equities/40% Long GC asset allocation. Given higher yields today, the plan sponsor is looking to de-risk and protect their funded status by changing their asset allocation to 50/50. Below we explore a more capital efficient way to de-risk by having the plan’s fixed income allocation go further in increasing their duration risk hedge.
Solution: Extend the Duration of FI Assets to Reduce Funded Status Volatility
Rather than simply shifting assets out of their existing equities allocation to fund the increased long government/credit allocation, we suggested that they consider further extending the duration of their fixed income allocation using STRIPS and thereby increasing their hedge of liabilities. With today’s higher yields, the uptick in expected returns between equities and fixed income is much less than it was when rates were closer to zero, as they were for much of the last decade. With higher rates sponsors may want to build-in additional protection against rate declines which we all know would have a very damaging effect on funded status. Therefore, plan sponsors may want to both allocate more to fixed income and to increase the duration of that fixed income exposure, which has the effect of further reducing the gap between the duration of their liabilities and the contribution to duration of their assets. In Figure 6 we illustrate how using 20+ year STRIPS to extend duration relative to a simplistic 50/50 allocation can lower funded status volatility by almost 100 bps, while the impact on expected returns is de minimis.
Figure 6: DB Metrics Under a Capital Efficient Approach
| Liability* | Traditional 60/40 LDI Portfolio | Traditional 50/50 Portfolio | Capital Efficient Portfolio | |
|---|---|---|---|---|
| Long Government Credit (%) | — | 40 | 50 | 0 |
| Long Corporate (%) | — | 0 | 0 | 25 |
| US Strips 20+ Year | — | 0 | 0 | 25 |
| S&P 500 Index | — | 60 | 50 | 50 |
| Total Fixed Income (%) | — | 40 | 50 | 50 |
| Equity (%) | — | 60 | 50 | 50 |
| Total Portfolio (%) | — | 100 | 100 | 100 |
| Fixed Income Duration | 13.98 | 14.21 | 14.21 | 19.08 |
| Total Contribution to Duration** | 13.98 | 5.40 | 6.75 | 9.06 |
| Duration Risk Hedged (%) | — | 38.6 | 48.3 | 64.8 |
| Projected Return*** | — | 5.26 | 5.17 | 5.16 |
| Projected Funded Status Volatility (%)**** | — | 8.54 | 7.15 | 6.17 |
| Return/Funded Status Volatility | — | 0.62 | 0.72 | 0.84 |
*FTSE Pension Liability Index (Intermediate)
**Calculated assuming a 95% funded pension plan.
***Based on fixed income index yields to worst and State Street Global Advisors long-term projections for equity returns.
****Based on historical portfolio allocation returns versus the FTSE Pension Liability Index (intermediate) returns.
Source: FTSE, Bloomberg, MSCI, State Street Global Advisors analysis as of December 2023.
Problem: Market Effect (Transaction) Costs
For small- and medium-sized plans in separate accounts, an adequate level of credit diversification is often economically infeasible, increasing single-name concentration and providing a higher probability of idiosyncratic credit events. In addition, a separate account investor will bear the full cost of contributions and withdrawals, increasing transaction costs.
Solution: Benefits of Scale
With over $80 billion of client assets invested across these pools, and with 14 of the 18 pools individually exceeding $1 billion in client assets, the LDI Building Block funds provide economies of scale that are attractive relative to investing via separate accounts. Greater scale provides a wide range of benefits for investors. For example, larger commingled vehicles allow more efficient trading, leading to reduced costs related to subscriptions and redemptions. Smaller-sized investors typically face higher fees that can be detrimental to portfolio returns. In addition, with more assets, the funds can have greater diversification of issuers, leading to reduced credit risk.
Conclusion
Plan funded status has increased significantly for corporate DB plans, and it is no surprise that plans are seeking to lock in these gains. However, it is important that liability-driven investing is handled with care and pitfalls in liability hedging are avoided so that sponsors can achieve the element of control in managing their asset-liability goals. We look forward to helping DB clients achieve their investment goals using our suite of LDI Building Blocks, which are designed to stave off many of the common mismatches in assets and liabilities resulting from standard liability-aware investing with long-dated assets.