Investment Outlook
Fixed income has struggled relative to equities in 2026, even as geopolitical shocks would normally favour bonds. Where are the fixed income entry points in Q3? We explore three zones of opportunity.

European CLOs to benefit from rising coupons?
- Central bank policy tightening is back on the agenda. European AAA Collateralised Loan Obligations (CLOs) weathered the last European Central Bank rate-hike cycle and offer an attractive combination of high income, superior credit quality, and short-duration exposure.
The European Central Bank (ECB) raised its deposit rate by 25 basis points (bp) to 2.25% in June, in response to rising euro-area inflation. Recent oil-price falls may suggest easing inflation pressures, but the ECB is likely to maintain a tightening bias until the picture is clearer.
This backdrop remains supportive of short-duration exposures, barring a substantial weakening in growth, which appears less likely now that oil prices have retreated. As bond price gains are expected to be modest, coupon carry may play a bigger role in delivering fixed income total returns. This may encourage investors to reassess high yield strategies, which may offer a combination of relatively short duration and high coupons. High yield’s strong all-in yield profile has helped drive inflows1 but there may be limited room for additional spread tightening from current levels.
The CLO alternative
Instead of moving down the credit spectrum for yield, investors can consider Euro AAA CLOs, which offer a competitive income profile without the added duration:
- CLOs’ floating rate structure has historically delivered a greater share of return from coupon than from bond price appreciation. Coupon income has historically benefited from higher policy rates. Figure 1 shows cumulative returns from the J.P. Morgan European Collateralized Loan Obligation AAA-only Index during the last ECB tightening cycle, broken down into price and coupon returns. Returns were initially dragged down by negative price performance—but coupon income accelerated as rates rose. We expect returns to be more stable in this cycle, as coupon rates are currently higher than they were in the less-than-zero rate regime at the start of the last round of hikes.
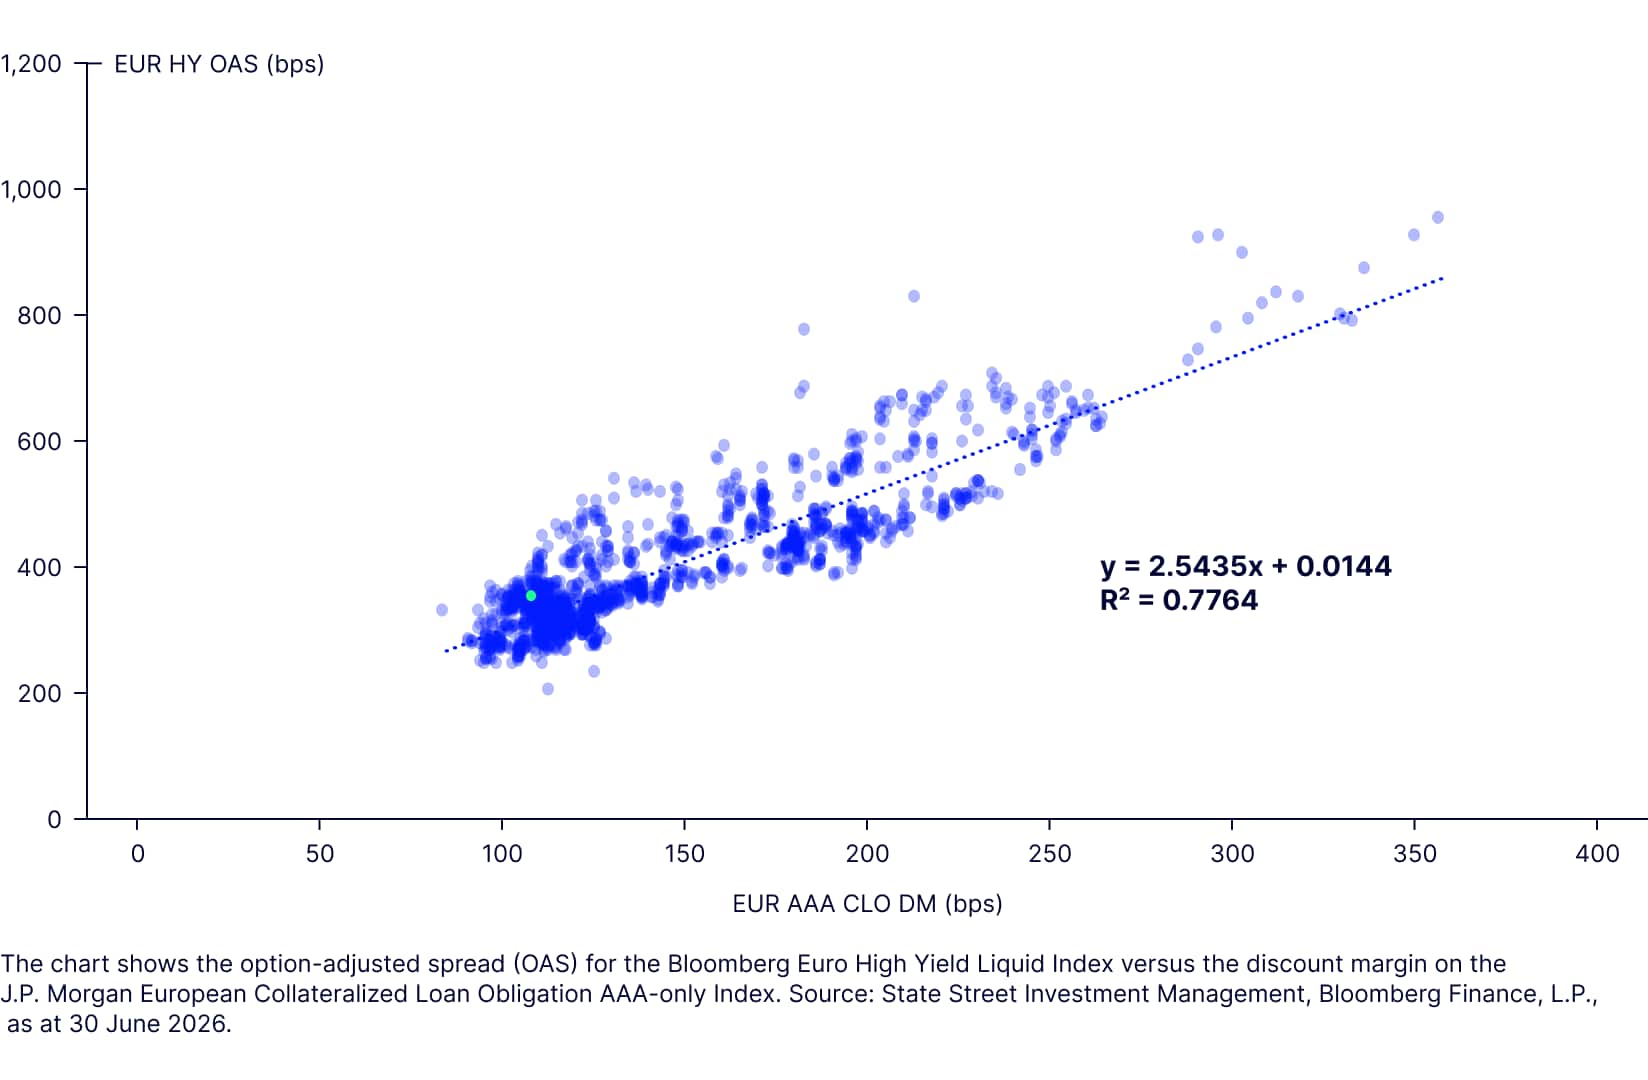
- Credit spreads on Euro AAA CLOs appear less stretched than many credit alternatives. Based on a seven-year history of spreads, both Euro investment grade and high yield spreads are more than 1.1 standard deviations tighter than their average, compared with 0.8 deviations for Euro AAA CLOs.2 As Figure 2 shows, the latest observation (pale dot) sits below the long-run trend line, meaning high yield spreads are narrower than the historical relationship with CLO spreads would imply. High yield spreads have also moved around 2.5 times as much as CLO discount margins over the period.
Figure 2: Euro high yield option-adjusted spread vs Euro AAA CLO discount margin
The combination of short duration and high yield offered by Euro AAA CLOs could be beneficial for portfolios. This proved to be the case at the start of the US-Iran conflict. The drawdown for Euro AAA CLOs was limited to 20bp over the first six days of the conflict—half that of short-maturity investment-grade strategies.3
The positive seasonality that has historically affected bond returns over the summer also applies to CLOs. Limited issuance activity, and an aversion to risk taking in an environment of lower liquidity during July and August, have driven positive Euro AAA CLO returns in both months for each of the past seven years.4
Implementation Ideas:
Implementation Ideas:
Tech sector fuels convertible bond momentum
- Convertible bonds’ recovery since a downturn at the start of the US-Iran conflict may continue if risk appetite persists. Tech-sector issuance has provided support.
This year has been challenging so far for fixed income investors. Bonds posted negative returns when they were needed as a hedge against March’s equity drawdowns. Equities rebounded afterwards but fixed income struggled—unhedged Bloomberg Global Aggregate Index first-half total returns are close to zero.5
Adding equity exposure to a fixed income portfolio sounds like a contradiction in terms, but it would have been beneficial this year. Convertible bonds returned nearly 16% in the first half of the year.6 Although a weak equity market and rising rates weighed on performance in March, convertible bonds’ relatively high delta was a strong driver of returns when equity markets rebounded later. At the same time convertible bonds’ relatively short duration limited the impact of higher rates movements and expectations.
Technology sector securities’ role in driving returns broadly mirrors equity markets year to date. The opportunity has not been confined to the US technology sector—Asian names have also posted significant gains.7
High levels of new issuance have helped too. Elevated borrowing rates and strong equity returns have pushed many issuers into the convertibles marketplace. The technology sector’s AI-investment requirements fuelled supply. These bonds have performed strongly and been a source of positive returns. With appetite remaining strong, and AI-related investment continuing, this supportive dynamic may persist in the second half of the year.
Delta: elevated, not excessive
The strength of the equity rally has raised the delta—or sensitivity of convertible bond prices to movements in the underlying equity. The FTSE Qualified Global Convertible Index currently has a delta of 58.9, above its long-term average of 46.4. However, it remains in the range we associate with a balance between equity upside and downside bond protection. It is below the peak seen in 2021 (67.1) and the recent high in February, before the US-Iran conflict (62.8).8
Several structural factors help prevent delta from drifting materially higher:
- Strong equity performance historically has driven delta upwards. But the FTSE Qualified Global Convertible Index caps any issuer at 4%. After a strong equity rally, the largest positions tend to be the highest-delta securities, so the cap has the practical effect of trimming delta concentration.
- Index rebalancing typically moderates overall delta as older higher-delta bonds drop out and are replaced by new lower-delta bonds. For example, the June 2026 index rebalancing reduced average delta by almost one point.9
- Buybacks have been a recent feature of the market. Issuers wanting to manage their balance sheet will often buy back deep in-the-money convertibles that have a high delta, removing them from the index.
Implementation Ideas:
Performance and index inclusions support Saudi debt
The US-Iran conflict still poses challenges to bond markets. But Saudi bonds weathered the initial storm, then rebounded. Over the longer term, low debt levels, and index inclusion flightpaths support the case for the segment moving to core emerging market allocation status.
The US-Iran conflict is not resolved and volatility remains a risk. Fixed income markets retain a higher inflation risk premium for now. The US 10-year Treasury yield fell below 4% at the end of February but has since risen back above 4.5%.
The path of Saudi Arabia bonds has been different. The initial drawdown in early March, in response to a conflict on the kingdom’s doorstep, was a little greater than that seen in US Treasurys—but the Saudi recovery has been swifter.10
Moving from niche to core
Looking over the longer term, there are several fundamentals-driven reasons for optimism around Saudi Arabian bonds.
- Debt levels: At a time when investors remain focused on sovereign debt levels, Saudi Arabia’s debt-to-GDP ratio of 32%11 stands out. Higher oil prices would further reduce the deficit. Alongside this, the Vision 2030 programme is accelerating diversification and modernisation, helping strengthen the Saudi economy. This has been reflected in a series of sovereign credit ratings upgrades.12
- Yield advantage: Saudi Arabian bonds offer an attractive income profile. The yield to maturity on the J.P. Morgan Saudi Arabia Aggregate Index is 5.15% compared with 4.37% for the Bloomberg US Treasury Index.13 Within the USD-denominated Gulf bond market, Saudi bonds provide a yield premium of around 30bp over Abu Dhabi debt and 40bp to Qatar fixed income.14
- A market poised for broader adoption: Foreign ownership of Saudi Arabian local-currency bonds is just 3.7%.15 Demand could rise further when Saudi riyal-denominated government sukuk—the Islamic equivalent of conventional bonds, and the instrument used for the kingdom’s local currency issuance programme—are included in J.P. Morgan’s GBI-EM index series from January 2027 and in Bloomberg’s EM local currency indices from April 2027.16
Evidence of increased appetite for local currency bonds from foreign investors may already be emerging. As Figure 4 shows, foreign participation rates in the issuance of new local currency bonds increased to close to 12% in 2025 from practically zero in 2022. By the end of April 2026, the rate was 7.9%.17 We think this figure could rise as index inclusion moves closer.
Although Saudi Arabia’s initial weights in these local currency benchmarks are expected to be modest, they could grow over time as issuance expands to support Vision 2030-related initiatives. Combined with improved market access, this could help Saudi bonds move from a niche allocation to a core component of EM local-currency bond portfolios.
For a more in-depth look at Saudi Arabian bonds see our publication: Saudi Arabian bonds: the case beyond the conflict
Implementation Ideas:
Read our Q3 inflation outlook