How & Why the S&P 500 ESG Leaders Index Works
The S&P 500 ESG Leaders Index excludes companies that engage in controversial business activities and favours those with best-in-class ESG scoring. With similar industry group weights to the S&P 500, tracking is kept low, with any difference historically being to the benefit of the ESG Leaders. It has the highest return of all S&P ESG indices over the last 12 months.
Overview
The S&P 500 ESG Leaders Index methodology offers access to securities with stronger-than-average ESG characteristics, as well as key activity and behavioural exclusion screens. The index has proved popular given its broad allocation, which maintains similar risk-return characteristics to its parent benchmark, the most popular investor benchmark, S&P 500.
In this update, we explore performance over the past 12 months, a period of stock market extremes and varied opinions on ESG investment, and detail the outcome of the annual rebalancing.
Quick Reminder on Index Construction
The S&P 500 ESG Leaders Index tracks the performance of the leading S&P 500 Index after a set of exclusion and ESG performance screens are applied.
Stocks are deemed ineligible for inclusion in the index on the basis of:
- Negative screening on business activity
- Behavioural issues
- Low ESG score
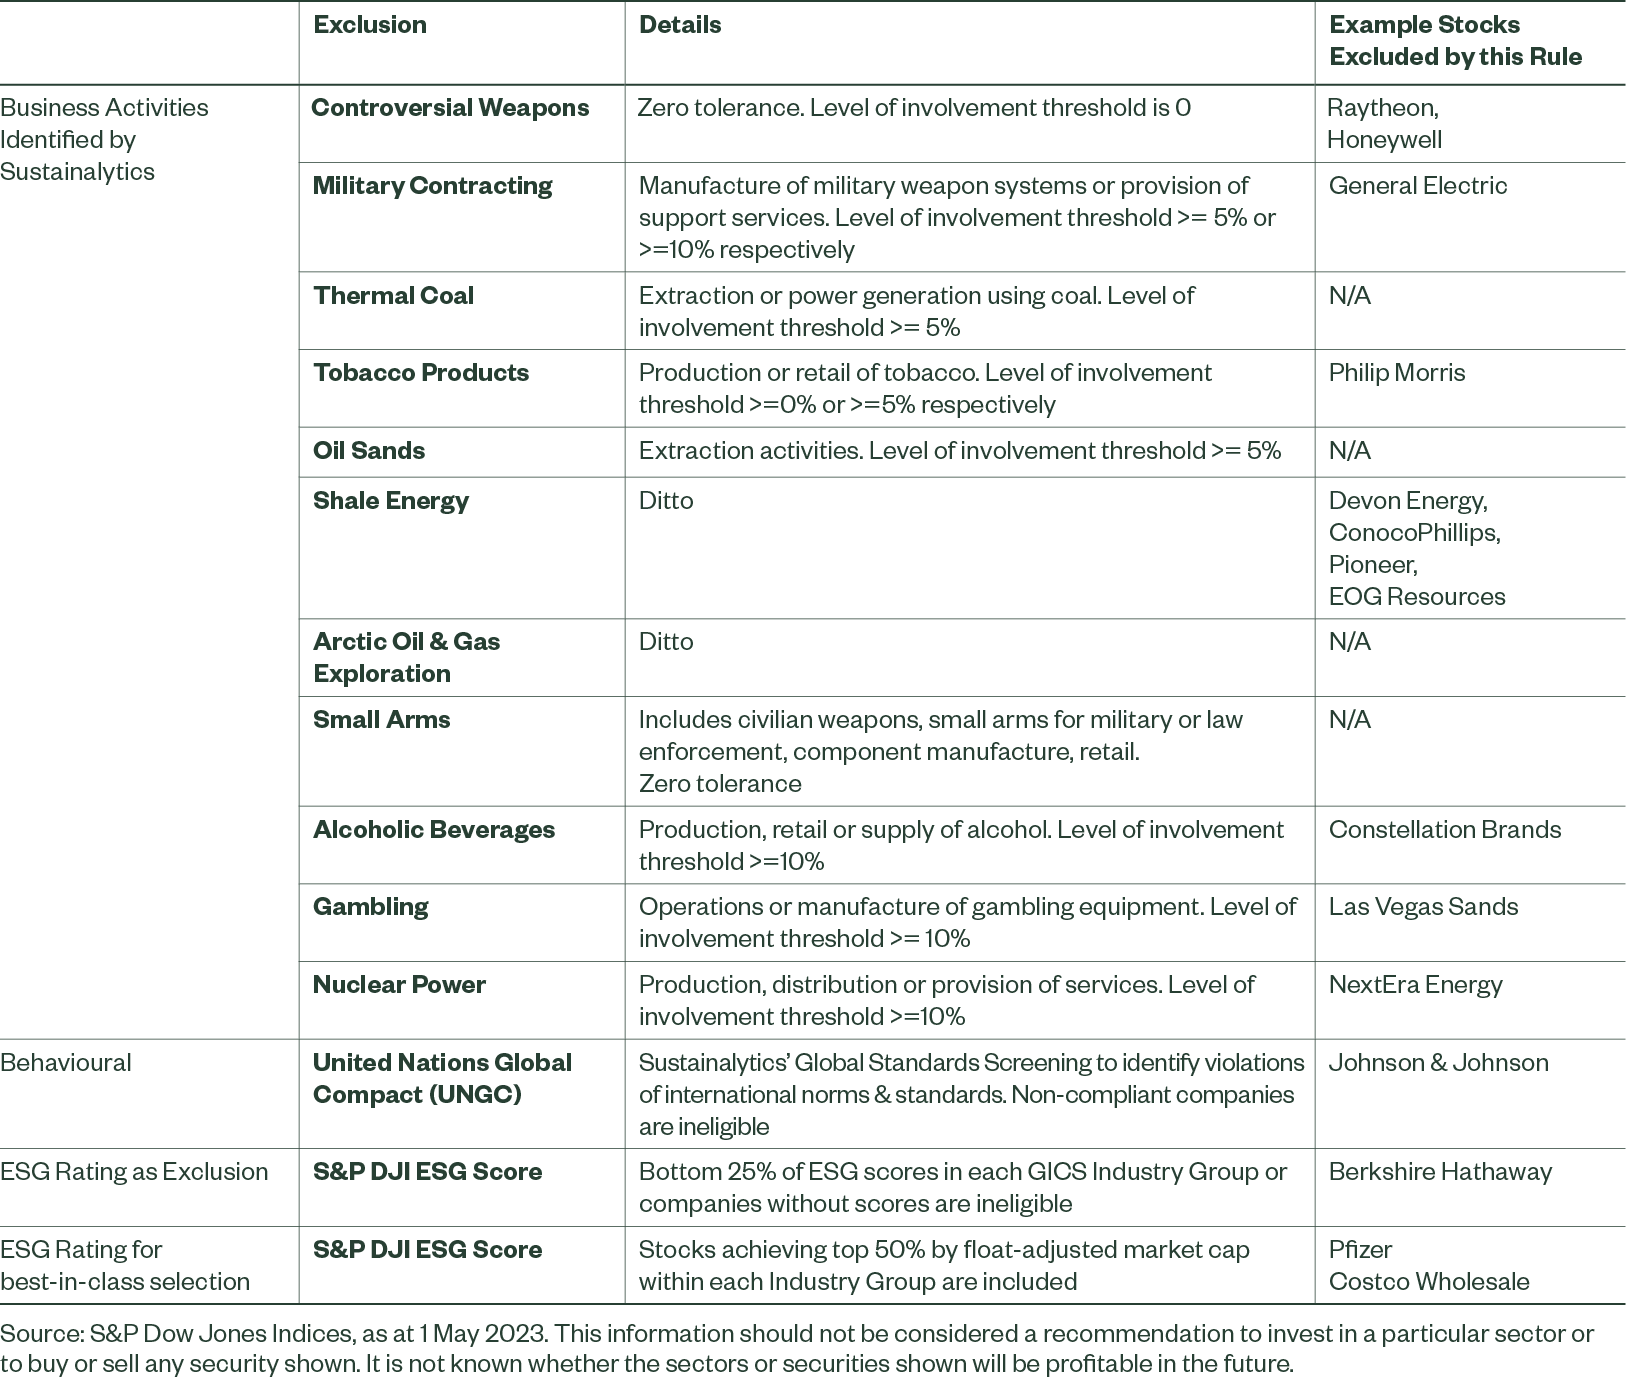
The exclusions cover business activities, namely involvement in controversial weapons, fossil fuels, tobacco, alcohol, gambling, civilian firearms, nuclear power and companies with disqualifying UNGC Scores, as determined by Sustainalytics.
Thereafter, companies with S&P DJI ESG scores in the bottom 25% of each GICS Industry Group are also excluded. The ESG scoring is an aggregation of environmental, social and governance scores that measure ESG risk and performance factors with a focus on financial materiality. Eligible securities are ranked in descending order of their S&P DJI ESG score, and then selected for index inclusion up to a level of the top 50% by float-adjusted market cap within each GICS Industry Group.
In addition, controversies are identified through Media & Stakeholder Analysis, which involves daily filtering, screening and analysis provided by RepRisk.
This methodology results in an index of just over 200 stocks, with index constituents weighted by their market capitalisation, with a limit of 5%.
Results Show this Methodology is Working
Looking at actual and back-tested figures for the past 10 years, the S&P 500 ESG Leaders Index has achieved slightly higher returns than the parent index, with a small addition of volatility, in most periods. We see similar risk-adjusted returns despite excluding 300 stocks, which reflects relatively low tracking and is in line with the index objective.
Figure 1: Risk/Return Profile vs. Parent Index
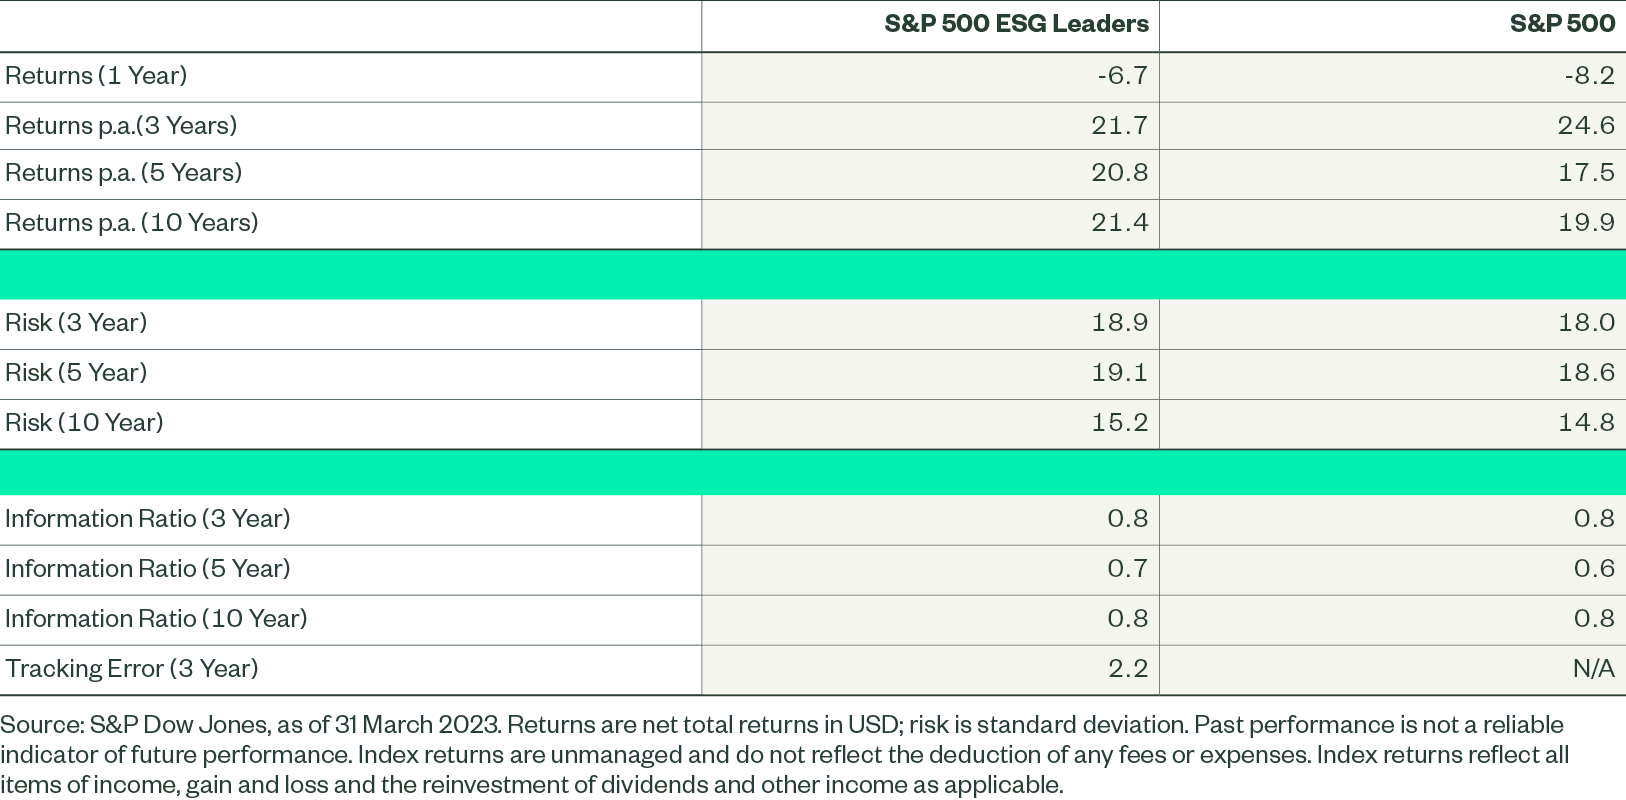
Excluding 300 stocks from the S&P 500 index could have a big impact on relative performance (both positive and negative). As mentioned above, the exclusions have actually been beneficial to relative returns in recent years, although somewhat negated by added risk.
Overweight exposure to some of the largest stocks in the market, including Alphabet, Amazon, Microsoft and Apple has given the S&P 500 ESG Leaders Index a significant performance boost year to date in 2023.* The index has been outperforming the parent index, S&P 500, and the competitive index, S&P 500 ESG, as the FAANGs have dominated US stock market moves.
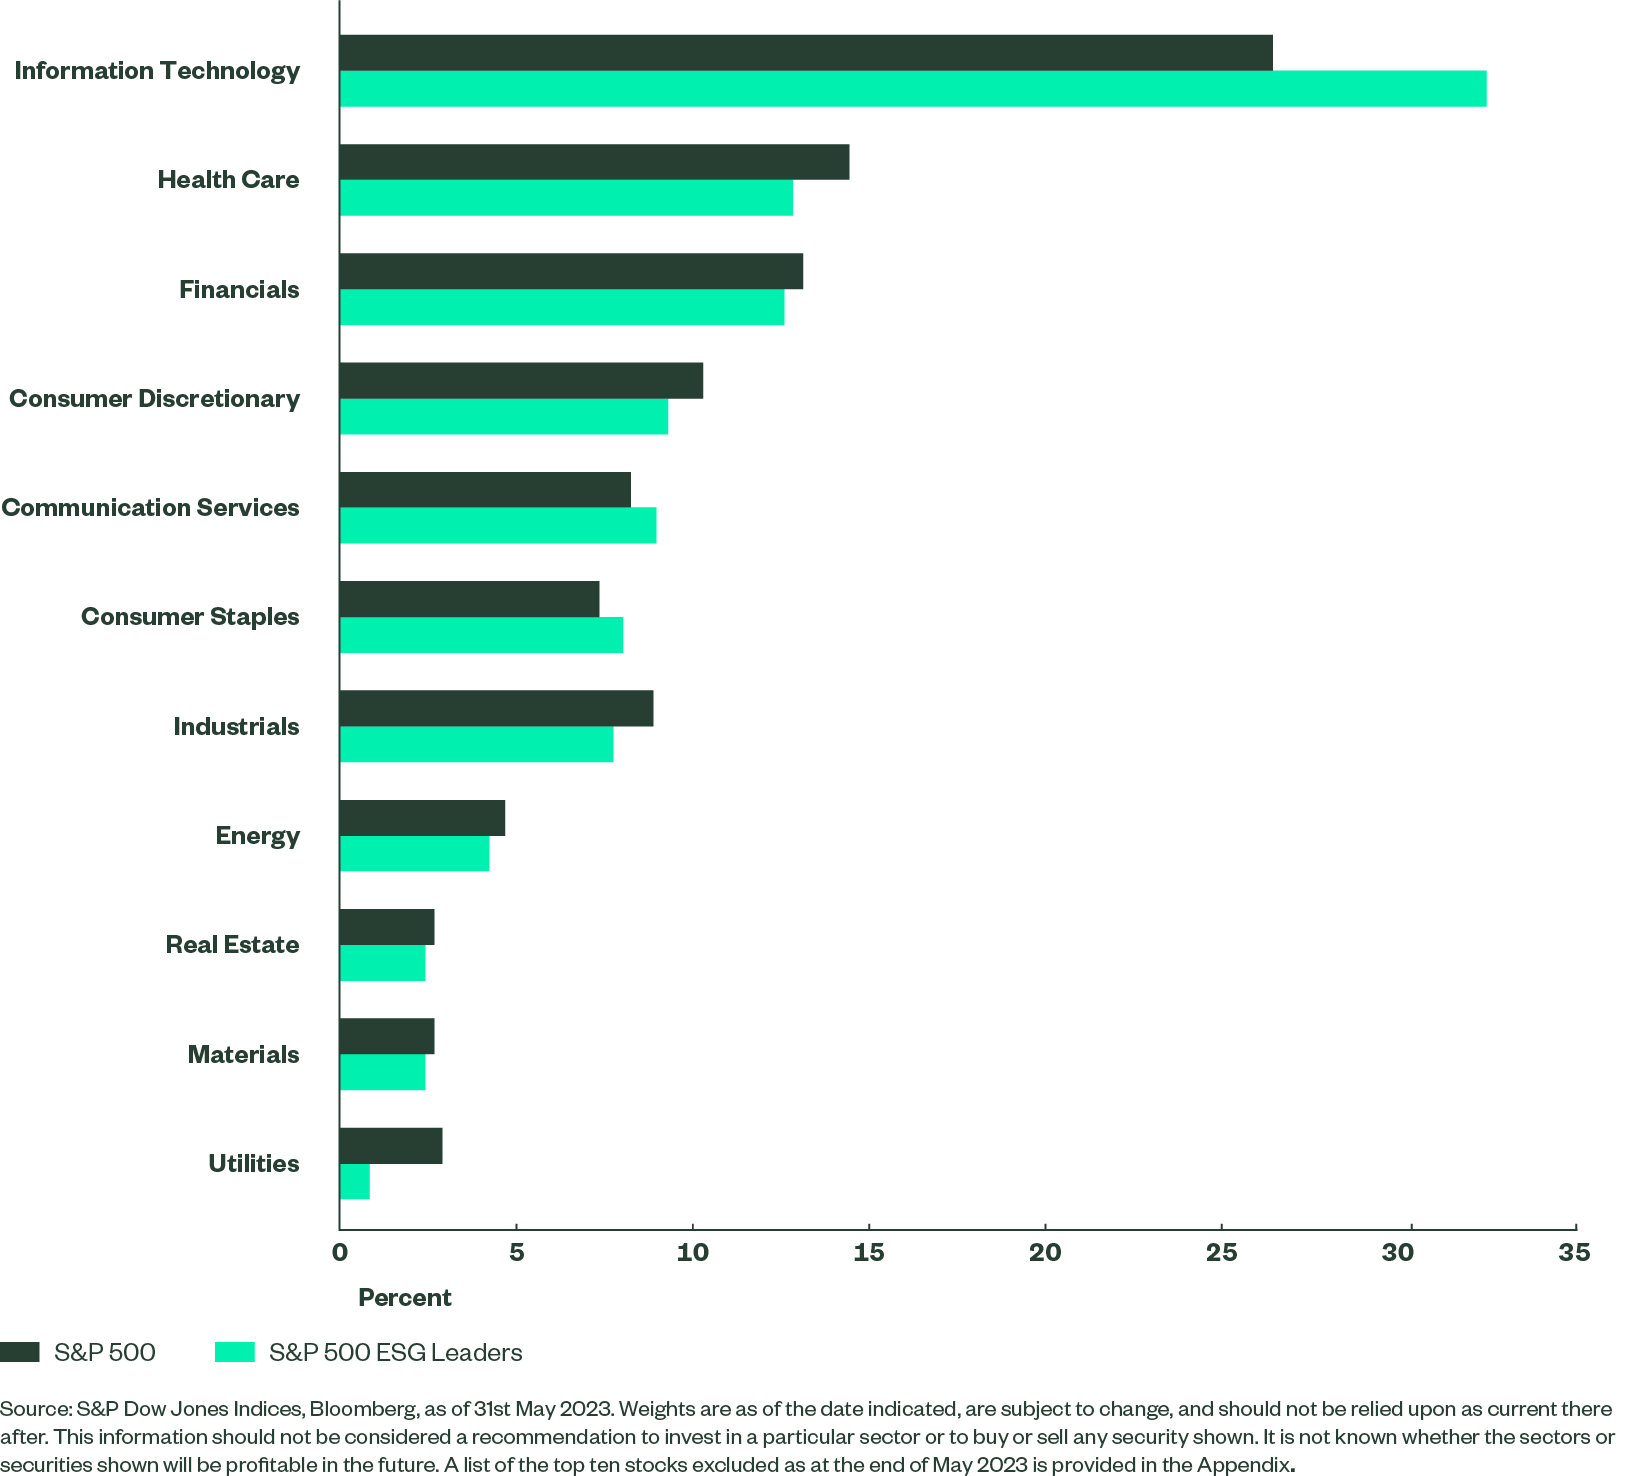
Looking at performance attribution for the 12 months to the end of Q1 2023, the S&P 500 ESG Leaders Index’s significant overweight to technology (see Figure 2) was responsible for a large positive allocation effect and an overweight position in Nvidia gave an outsized selection effect.* Stock selection in financials, which favoured the larger banks, including JP Morgan, also greatly benefited relative performance.* Meanwhile, noteworthy detractions to relative performance came from the exclusion of Meta in communication services and the underweight to consumer discretionary.1
Figure 2: Sector Split Ranked by Most Overweight to Most Underweight (%)
Keeping Up to Date
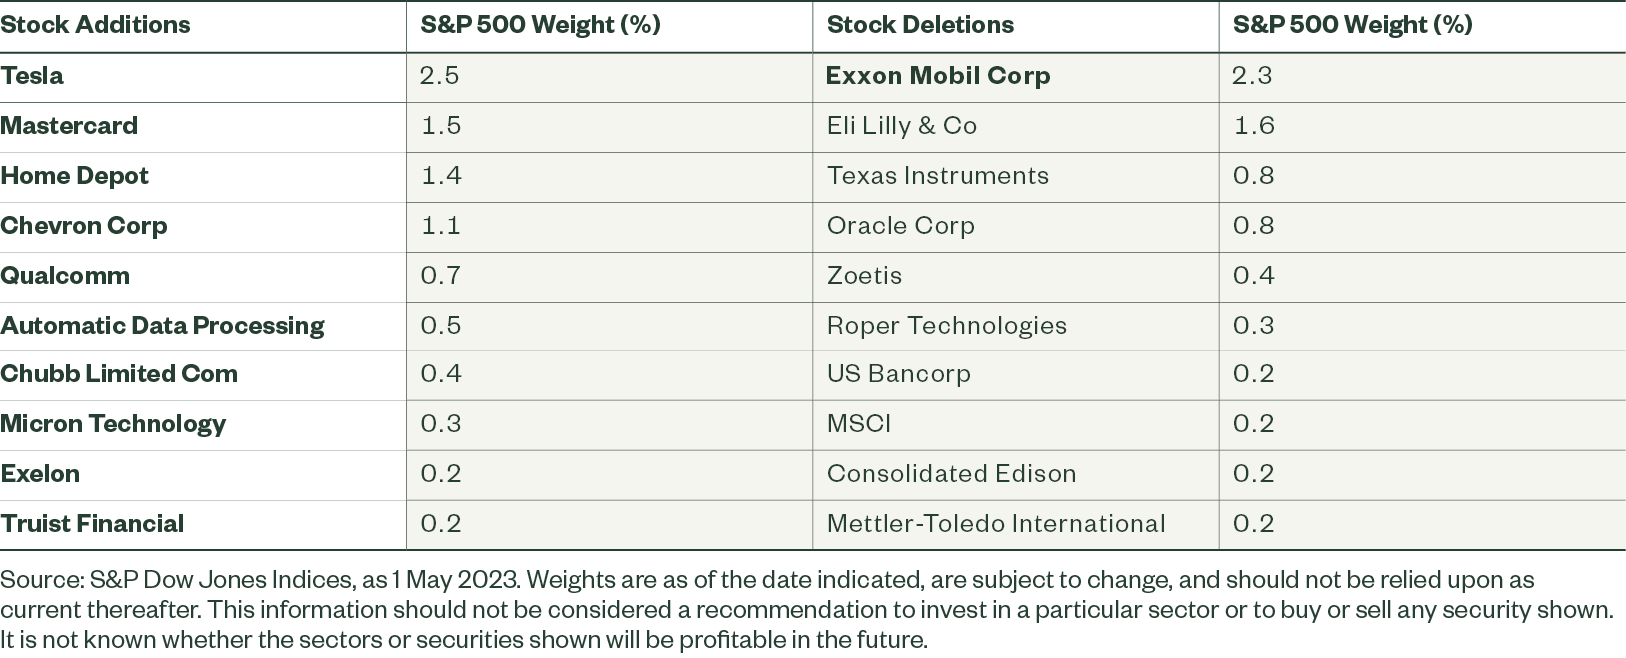
The index is rebalanced annually at the start of May. In the most recent exercise, 29 stocks were added to S&P 500 ESG Leaders Index and 27 were excluded, with one-way turnover of 13%.
This list included several high-profile stocks. Tesla gained entry to the index as a result of its S&P DJI ESG Score improving relative to its GICS Industry Group (automobiles & components).* The stock’s previous disqualification had caused consternation among some investors because of Tesla’s important role in propelling the switch to electric vehicles. This showed the impact of best-in-class E, S and G scoring.
An example of Tesla’s improvement over the past year, which came on the environmental side, was the introduction of reporting on Scope 1, 2 and 3 carbon emissions and the disclosure of information about the company’s climate strategy.
Fossil-fuel producer ExxonMobil had also caused a lot of ESG discussion, given it had previously made it into the index in light of its relatively high S&P DJI ESG score compared with oil-producing peers.* However, the stock received a lower environmental score in the most recent assessment as a result of several concerns on policy management, including clear air act violations, earthquakes caused by gas extraction, and wastewater leakages.
The lower ESG score for ExxonMobil has led to it being dropped from the index while competitor Chevron has been added.*
Figure 3: Top 10 Stock Adds & Drops at Latest Rebalancing (May 2023)
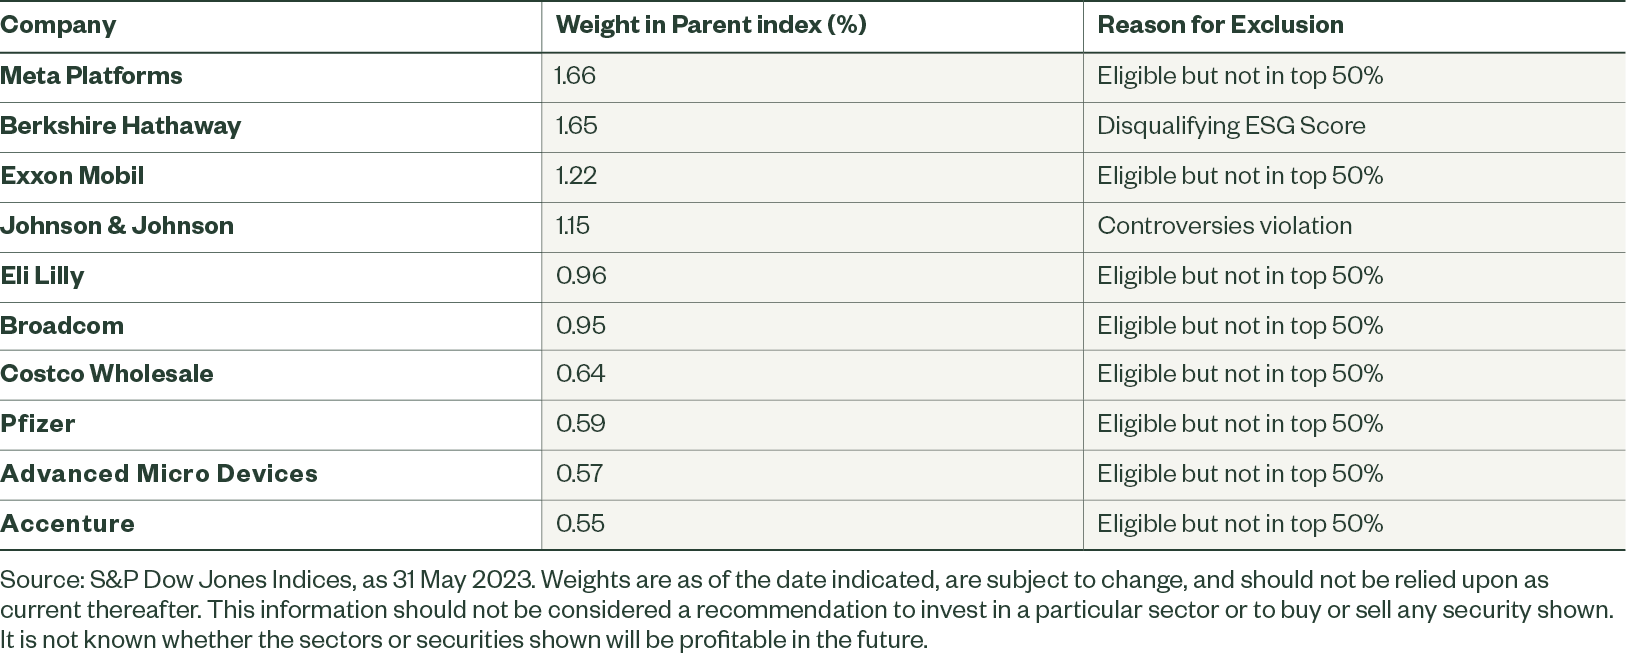
Appendix A: Top 10 Stock Exclusions Post Rebalancing
Appendix B: Exclusions by Category Post Rebalancing