Global Shariah equities: Quality investment for the future
“Shariah” means “the correct path” in Arabic and Shariah-compliant investing seeks to align equity portfolios with Islamic principles and values. This article explores how ethical screening and sector exclusions naturally lend themselves to a higher-quality portfolio, and how our Fundamental Active Equity Team’s quality-growth approach complements Shariah frameworks.
In Shariah-compliant portfolios, every security is screened to ensure it complies with Shariah principles by both assessing the nature of its business and by analyzing its financial ratios. Securities which do not comply are then excluded. A Shariah governance screen will search for a company’s revenue exposure to a prohibited industry (for example, gambling), and if the company does not meet the required criteria, it will be excluded from the investable universe.
Shariah-based benchmarks
Equity portfolio managers in fundamental equities are usually measured against an equity index, which acts as a benchmark for their performance. An asset allocator will determine which Shariah-based index they prefer portfolio managers to use as their benchmark.
Index providers will have their own Islamic law consultants to help them implement Shariah governance and this in turn helps define Shariah benchmark methodology and compilation. As a result, sector and index weights in Shariah-based indices from different index providers can vary substantially.
The exclusion of high-debt and interest-based businesses, such as those in the Financials sector, give Shariah-indices a higher “quality” style factor. This puts the focus on investing in firms with lower leverage and more conservatively managed balance sheets.
Despite Shariah governance exclusions, we find good depth of coverage across Shariah benchmarks, which enables portfolio construction with good diversification.
How the indices compare
There are significant sectoral and regional differences between the standard MSCI All Country World Index (MSCI ACWI) and the two Shariah-based indices considered in this paper—the DJ Islamic World and the MSCI ACWI Islamic M Series.
Where sector weightings are concerned, Shariah governance considerations move both Shariah indices towards Information Technology and Healthcare and sharply away from Financials.
Figure 1: Sector weights
| Index Differences | |||||
| MSCI ACWI | DJ Islamic World | MSCI ACWI Islamic M Series | MSCI ACWI - DJ Islamic World | MSCI ACWI - MSCI ACWI Islamic M | |
| Communication Services | 8.6 | 7.3 | 1.3 | 1.3 | 7.3 |
| Consumer Discretionary | 10.4 | 12.8 | 11.5 | -2.4 | -1.1 |
| Consumer Staples | 5.8 | 5.3 | 6.5 | 0.5 | -0.7 |
| Energy | 3.6 | 3.3 | 4.2 | 0.2 | -0.6 |
| Financials | 17.8 | 3.2 | 0.5 | 14.6 | 17.3 |
| Healthcare | 8.9 | 12.1 | 16.8 | -3.2 | -7.9 |
| Industrials | 10.9 | 10.7 | 11.5 | 0.2 | -0.6 |
| Information Technology | 25.9 | 39.2 | 40.4 | -13.3 | -14.4 |
| Materials | 3.5 | 4.6 | 5.7 | -1.1 | -2.2 |
| Real Estate | 2.0 | 1.1 | 1.2 | 0.9 | 0.7 |
| Utilities | 2.6 | 0.4 | 0.4 | 2.2 | 2.2 |
| Total | 100.0 | 100.0 | 100.0 | ||
| Number of names | 2,528 | 4,490 | 972 | ||
Sorted according to MSCI GICS for comparability, all data in percent. Sources: Bloomberg, Factset, MSCI and Dow Jones Indices, all data as of June 30, 2025. MSCI ACWI Islamic M number of names at May 31, 2025. Source: MSCI.
Where regional weights are concerned, the US takes the lion’s share in all indices due to the outperformance of the US equity markets relative to other markets over the last decade, and especially in Information Technology.
Figure 2: Regional weights
| Index Differences | |||||
| MSCI ACWI | DJ Islamic World | MSCI ACWI Islamic M | MSCI ACWI - DJ Islamic World | MSCI ACWI - MSCI ACWI Islamic M | |
| Canada | 2.8 | 1.6 | 2.4 | 1.19 | 0.43 |
| Emerging Markets | 10.0 | 9.7 | 9.2 | 0.36 | 0.83 |
| Europe Ex Uk | 10.3 | 7.3 | 11.4 | 3.26 | -1.12 |
| Japan | 4.9 | 4.2 | 3.9 | 0.70 | 0.95 |
| Pac Basin Ex-Japan | 2.4 | 1.4 | 1.6 | 1.07 | 0.86 |
| United Kingdom | 2.6 | 1.6 | 2.5 | 1.04 | 0.08 |
| United States | 66.1 | 73.8 | 68.4 | -7.67 | -2.32 |
| Middle East | 0.9 | 0.9 | 0.6 | 0..01 | 0.26 |
| Total | 100.0 | 100.0 | 100.0 | ||
Sources: Bloomberg, Factset, MSCI and Dow Jones Indices, all data as of June 30, 2025; for MSCI ACWI, DJ Islamic World, Country of Risk.
Tailor-made for Shariah: State Street’s Confidence Quotients
State Street Investment Management’s Fundamental Equity team’s investment style is defined by our quality-growth philosophy. This is implemented using in-depth stock analysis and by taking a longer-term, i.e., three-to-five year, investment horizon for our earnings forecasts.
Our Confidence Quotients (CQs) help test the premises of our earnings forecasts as well as their robustness. Our CQ analysis also helps us identify potential stock-specific risk.
“Quality” growth is expected to be durable, which also implies it is underpinned by a high CQ rating. By “durable”, we mean growth that is maintained and compounds at the forecast rate over the forecast period.
Figure 3: Confidence quotients
| CQ Category | Quality Assessment | Example CQ Score* |
| Management | Conviction in Leadership
| 8.0 |
| Market Position | Durable Competitive Advantage
| 8.3 |
| Financial Condition | Strength of the Financial Model
| 7.7 |
| Transparency | Visibility of Business Model
| 6.6 |
| Fundamental Momentum | Whether Business is Trending Positively
| 7.0 |
| Composite CQ Score (average) | 7.5 |
‒ Scores assigned by research analysts on a screened universe (roughly 25% of companies globally)
‒ Average global company CQ score = 5
‒ CQ scores are comparable between sectors and regions
‒ Changes in score signal improvement or deterioration of fundamentals
‒ Material Sustainability considerations are integrated into the CQ Quality assessment.
Our analyst team have strong industry expertise which comes from many years of researching and forecasting their sectors. Analysts run research portfolios consisting of the top ten to fifteen names in their respective sectors. The stocks are all chosen after thorough analysis and testing of earnings growth forecasts using the CQs.
Our analysts look for quality, i.e., high CQ, growth at a reasonable price. The resulting analyst conviction then enables us, as portfolio managers, to access a diverse and strong mix of stocks which have reasonable valuations relative to their forecast growth rates.
CQ scores and their components will change over time as analysts review companies’ earnings forecasts or any news which could potentially affect a company’s future, such as a change in senior management or a change in the competitive landscape.
Our CQs also integrate sustainability considerations which align well with Islamic investors' ethical approach to investing through Shariah.
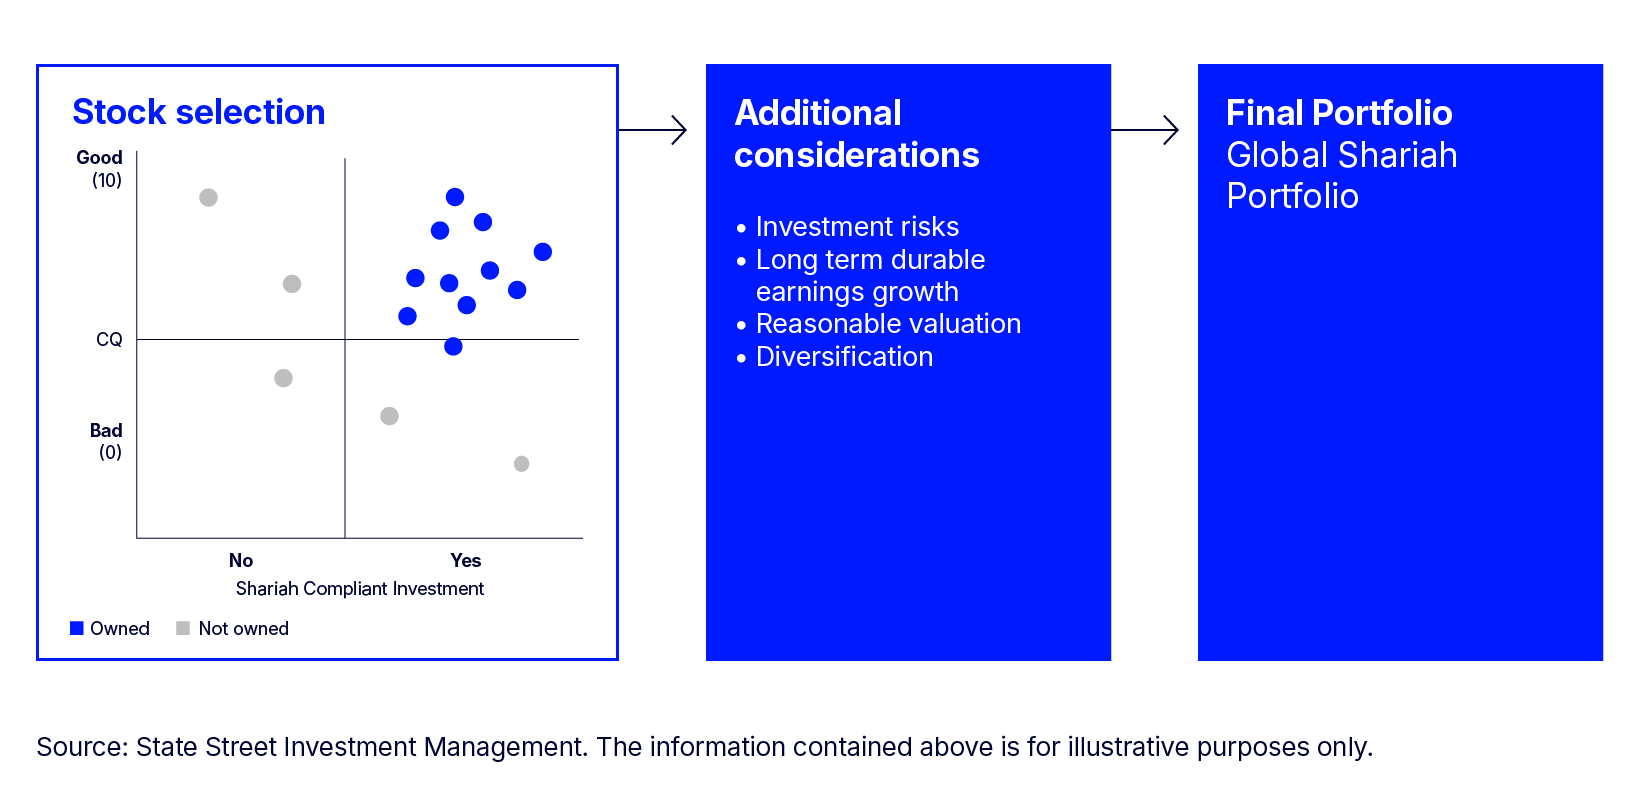
Alongside Shariah-compliant stock selection, our Global Equity Shariah-Compliant Strategy focuses on companies with strong CQ scores, and which meet our Fundamental Growth and Core Equity requirements for quality, durable growth, and reasonable valuation.
Figure 4: Portfolio construction
Shariah investment and longer-term investment trends
The implementation of Artificial Intelligence (AI) as an important corporate productivity tool is adding a major new dimension to the way we in turn evaluate our portfolio holdings, our earnings forecasts, and CQ analysis.
AI tools for business have been improving dramatically and quickly, and one key new development is Agentic AI, which can be tailored to accomplish specific tasks. These new AI tools have the potential to unlock vast improvements in productivity and efficiency. Competition in this new era will require firms to work harder to maintain market position. Smarter automation and a new era in robotics will also complement investment in AI.
Those firms which use AI effectively will win. And those which don’t, or can’t, will be at risk of losing market share or margin or perhaps fail altogether. New companies will emerge, including from faster growing segments in a firm, which are then IPO-ed. Overall, firms will succeed faster or fail faster.1
In addition, geopolitical competition is propelling the race towards Artificial General Intelligence (AGI) or superintelligence.
AI will be at the center and a driver for many industries:
Figure 5: Key industries, where AI will be at the center and a key driver
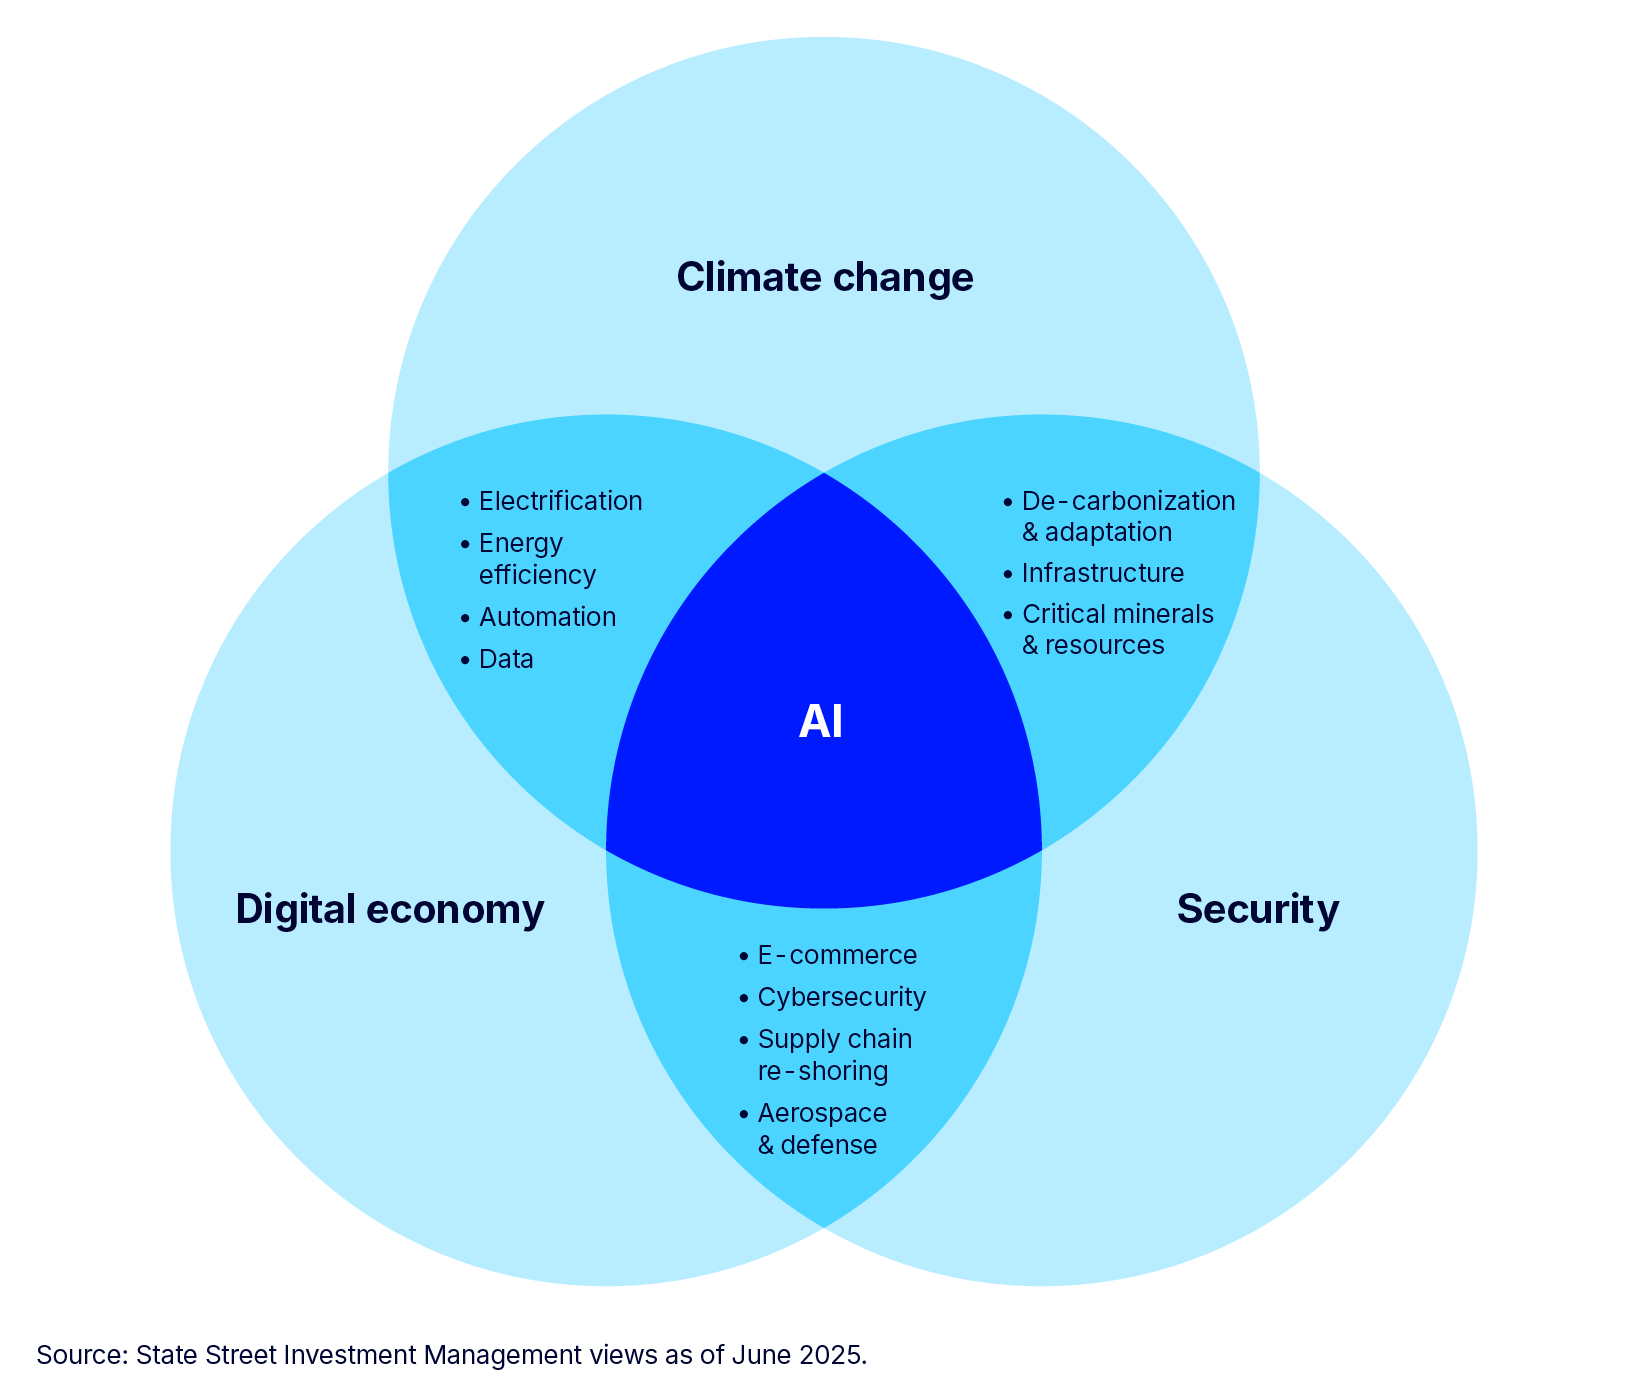
The defense sector is leaning towards sophisticated cyber and space technologies, many of which will rely on AI.
Climate resilience and dealing with climate-related events increasingly rely on AI.
The electric grid is faced with increasingly numerous sources of energy supply and this, coupled with fluctuations in demand, is more easily handled using AI.
Healthcare is set to be transformed by AI as are the Logistics and Auto Sectors.
Where Industrials are concerned, re-shoring and tariffs under President Trump may disrupt traditional trade flows in the short term. However, they will promote critical infrastructure build in the United States where a vast build-out of data centers for AI is very much part of the current Administration’s plans.
Conclusion
A prime focus on technology and innovation in the Shariah indices suggests that global Shariah investment is in line with future growth trends in the global economy.
Furthermore, our Fundamental Equity team’s investment style aligns well with Islamic investors' ethical approach to investing and Shariah governance. Our Confidence Quotients help to assess quality and the durability of future earnings growth. We believe we can deliver for our Shariah-based investors going forward.
Figure 6: Top Ten Index Stocks
| MSCI ACWI | % | DJ Islamic World | % | MSCI ACWI Islamic M | % | |
| 1 | NVIDIA Corp | 4.58 | NVIDIA Corp | 7.18 | NVIDIA Corporation | 9.47 |
| 2 | Microsoft Corp | 4.18 | Microsoft Corp | 6.89 | Microsoft Corporation | 5.36 |
| 3 | Apple Inc | 3.67 | Apple Inc | 5.71 | Broadcom Inc. | 3.35 |
| 4 | Amazon.com Inc | 2.49 | Amazon.com Inc | 3.86 | Tesla, Inc. | 2.48 |
| 5 | Alphabet Inc | 2.66 | Alphabet Inc | 3.46 | TSMC | 2.44 |
| 6 | Meta Platforms Inc | 1.92 | Meta Platforms Inc | 2.99 | Eli Lilly and Company | 1.72 |
| 7 | Broadcom Inc | 1.46 | Broadcom Inc | 2.41 | Exxon Mobil Corporation | 1.18 |
| 8 | Tesla Inc | 1.09 | Tesla Inc | 1.66 | Procter & Gamble Company | 1.03 |
| 9 | TSMC | 1.06 | TSMC | 1.63 | Johnson & Johnson | 1.01 |
| 10 | JPMorgan Chase & Co | 0.96 | Eli Lilly and Company | 1.14 | Home Depot, Inc. | 1.00 |
| Total | Totals | 24.08 | 36.93 | 29.04 |
Sources: Factset, MSCI and Dow Jones Indices, all data as of June 30, 2025. This information should not be considered a recommendation to invest in a particular sector or to buy or sell any security shown.